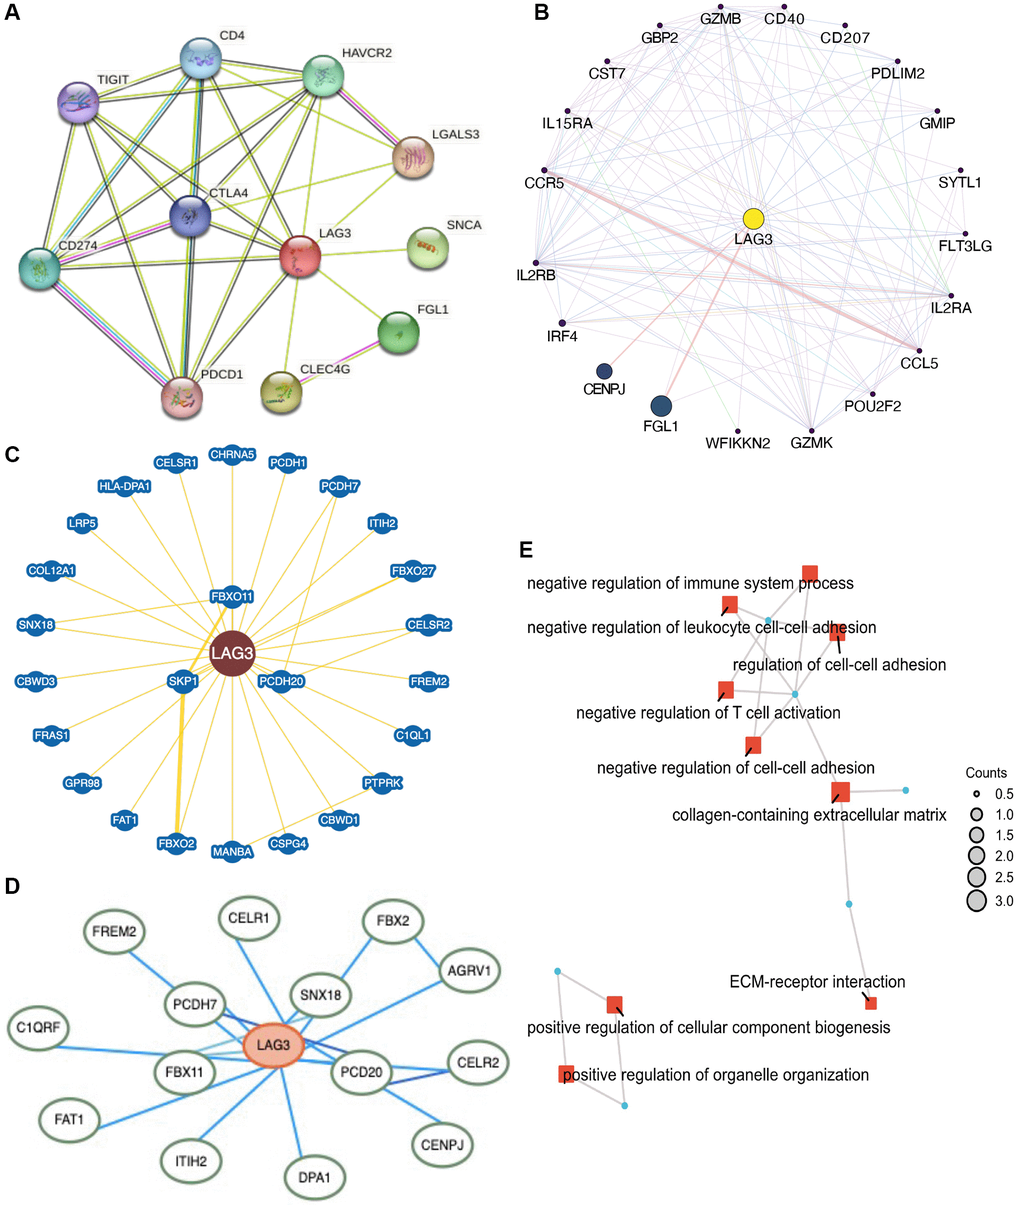
Figure 6.Network construction and enrichment analysis for LAG3 co-expression genes in KIRC. LAG3-related genes were analyzed via STRING (A), GeneMANIA (B), BioGRID (C), and HitPredict (D) sites. (E) GO and KEGG enrichment analysis.
Figure 6 — Integrative analysis of LAG3 immune signature and identification of a LAG3-related genes prognostic signature in kidney renal clear cell carcinoma | Aging