Submit an Article
Navigate
Home
Editorial Board
Editorial Policies
Current Volume
Archive
Scientific Integrity
Publication Ethics Statements
Interviews with Outstanding Authors
Newsroom
Sponsored Conferences
Podcast
Contact
Special Collections
Submit an Article
Online ISSN: 1945-4589
Research Paper
|
Volume 16, Issue 2
|
pp. 1968–1979
The role of miR-6884-5p in epithelial-mesenchymal transition in non-small cell lung cancer
Back to article
Figure 3
(3 of 6)
−
100%
+
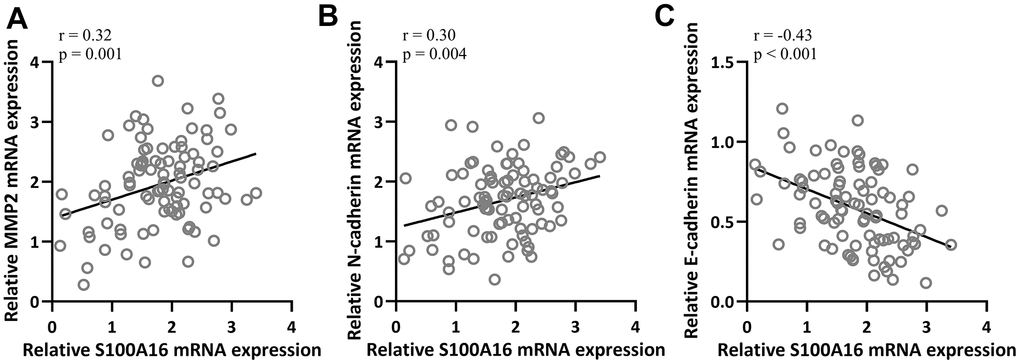
Figure 3.
Pearson correlation coefficient analysis was employed to analyze the correlations of mRNA expressions of S100A16 and the mRNA expressions of MMP2 (
A
), N-cadherin (
B
) and E-cadherin (
C
) in NSCLC tissues (n = 92).