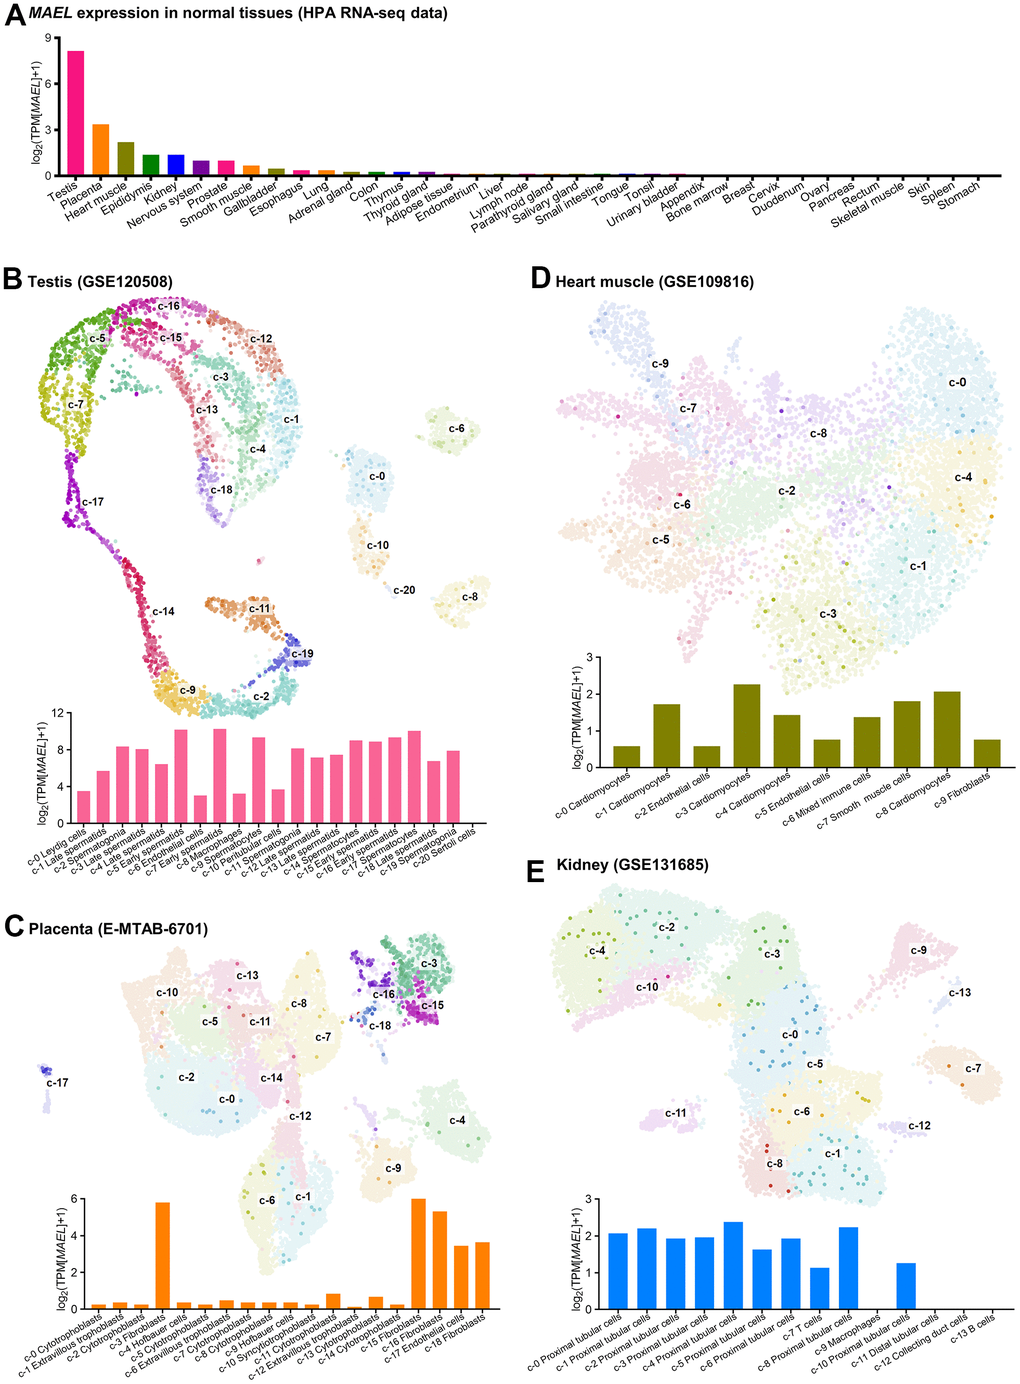
Figure 1.MAEL expression in normal tissues and single-cell clusters. (A) MAEL expression in normal tissues (tissue bulk RNA-seq, Human Protein Atlas). (B–E) UMAP plots and MAEL expression in the single cell clusters (single cell RNA-seq) of testis (GSE120508, B), placenta (E-MTAB-6701, C), heart muscle (GSE109816, D), and kidney (GSE131685, E). The depth of the color of each point reflects the relative expression of MAEL. Abbreviations: TPM=transcripts per kilobase million, UMAP=Uniform Manifold Approximation and Projection.