Submit an Article
Navigate
Home
Editorial Board
Editorial Policies
Current Volume
Archive
Scientific Integrity
Publication Ethics Statements
Interviews with Outstanding Authors
Newsroom
Sponsored Conferences
Podcast
Contact
Special Collections
Submit an Article
Online ISSN: 1945-4589
Research Paper
|
Volume 16, Issue 2
|
pp. 1879–1896
CDK16 as a potential prognostic biomarker correlated with an immunosuppressive tumor microenvironment and benefits in enhancing the effectiveness of immunotherapy in human cancers
Back to article
Figure 3
(3 of 11)
−
100%
+
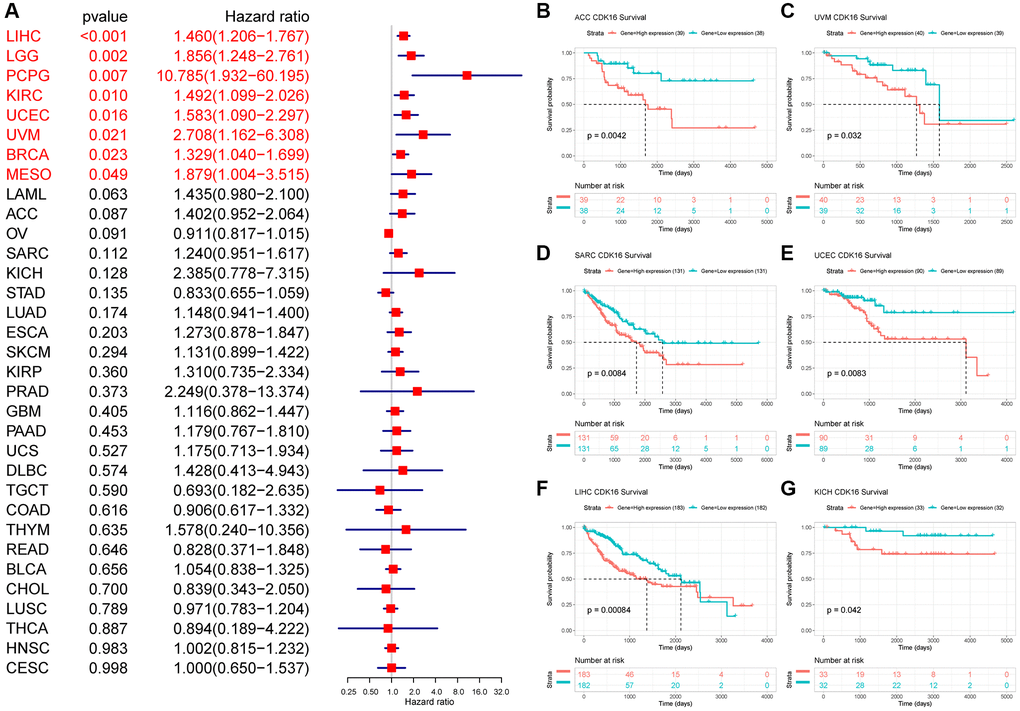
Figure 3.
Relationship between CDK16 level and OS.
(
A
) The univariate Cox regression OS analysis of CDK16 in TCGA pan-cancer. Red color represents significant results (
p
< 0.05). (
B
–
G
) Kaplan-Meier curves showing OS in pan-cancer.