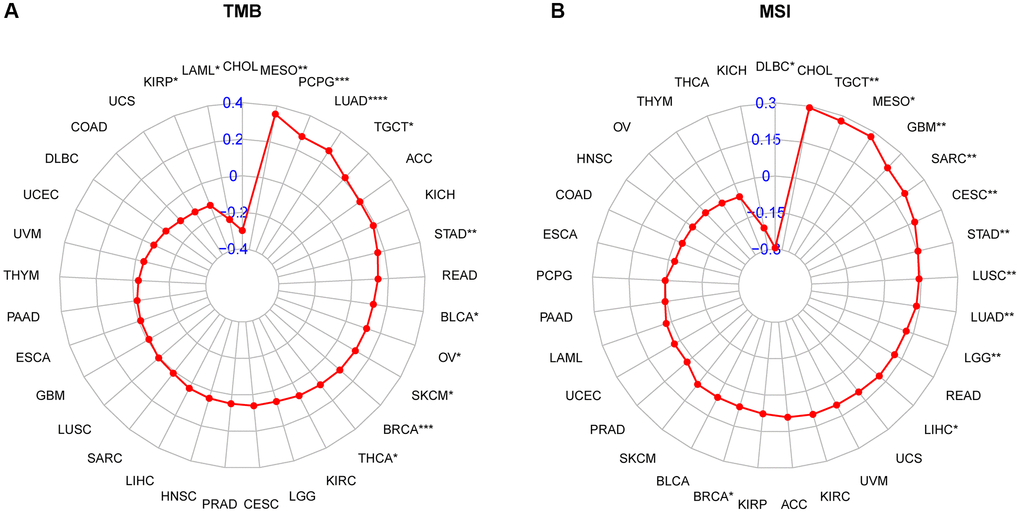
Figure 10.Relationship of CDK16 expression and tumor mutational burden (TMB), microsatellite instability (MSI). (A) Radar map illustrating the relationship between CDK16 expression and TMB. (B) Radar map illustrating the relationship between CDK16 expression and MSI. The red lines represent correlation coefficients, and blue values represent ranges. Spearman correlation test, *p < 0.05, **p < 0.01, ***p < 0.001, and ****p < 0.0001.