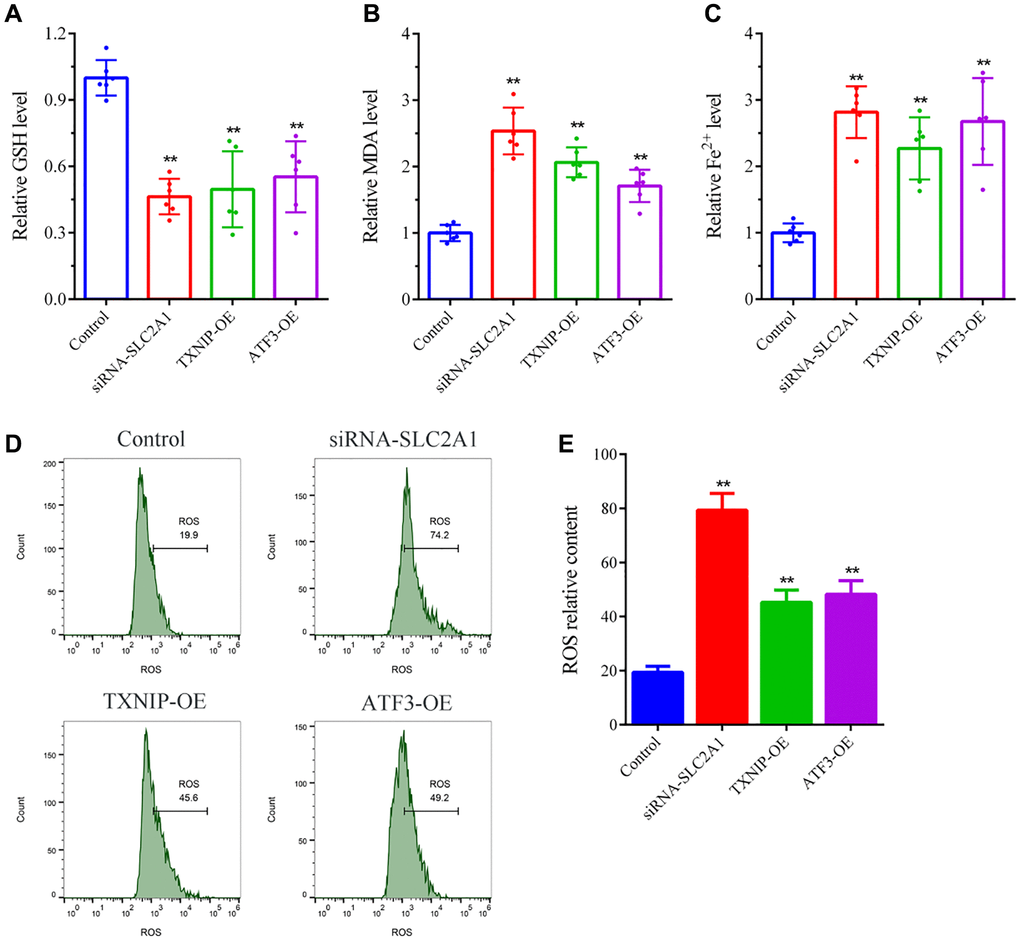
Figure 7.Ferroptosis detection in breast cancer cells. (A) GSH levels detection. (B) MDA levels detection. (C) Fe2+ levels detection. (D, E) ROS levels detection. The bar graphs show the mean ± SD of at least three independent experiments (n = 3). **P < 0.01, compared to the Control group, the difference is extremely significant.