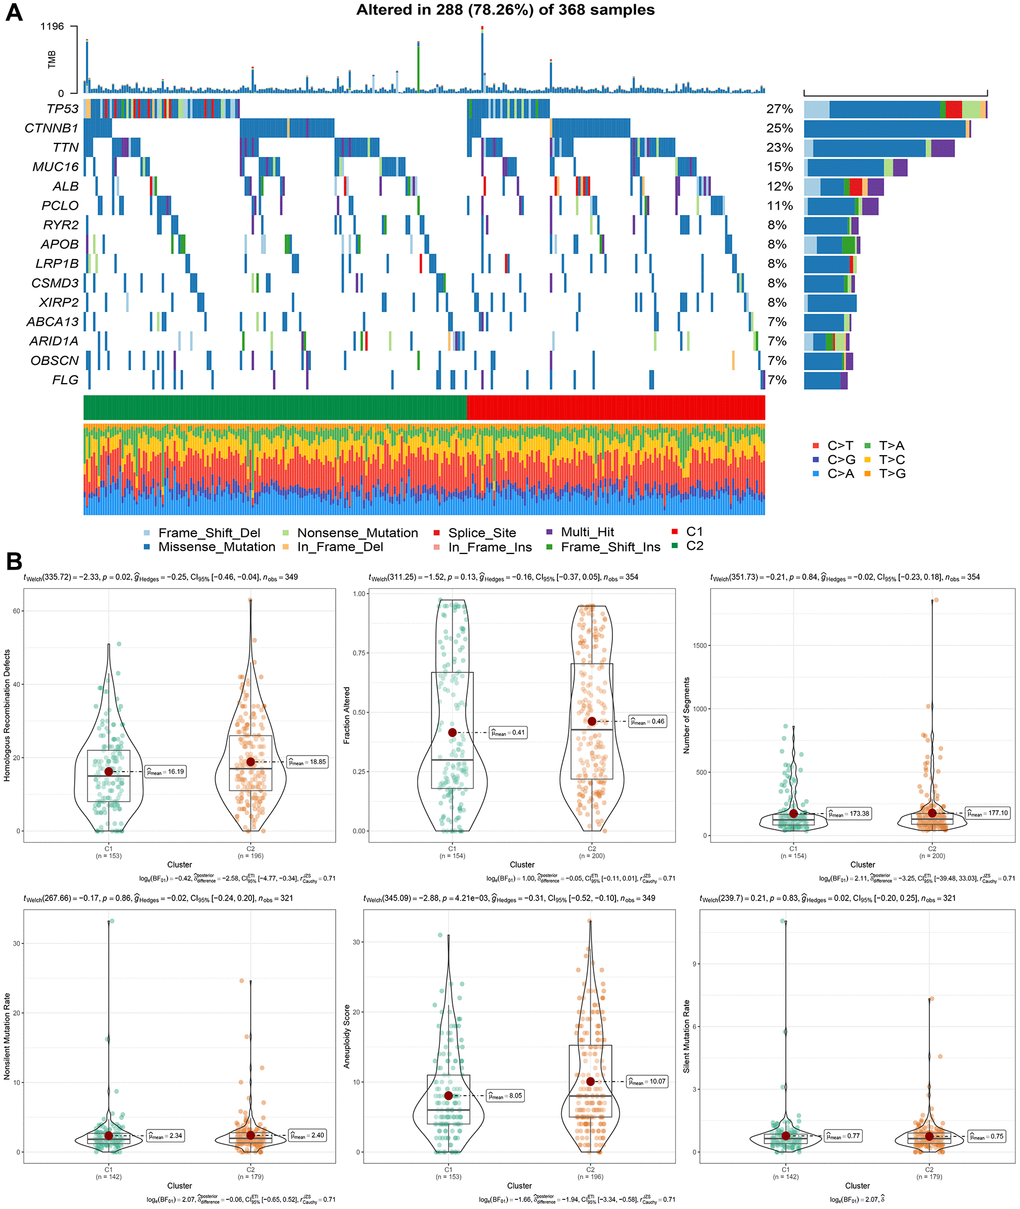
Figure 4.Genomic alterations in molecular subtypes of the TCGA cohort. (A) Somatic mutation analysis of different molecular subtypes in the TCGA cohort. (B) Comparison of “Homologous Recombination Defects”, “Fraction Altered”, “Number of Segments” “in different molecular subtypes of the TCGA cohort”. “Nonsilent Mutation Rate”, “Aneuploidy Score”, “difference in Silent Mutation Rate”.