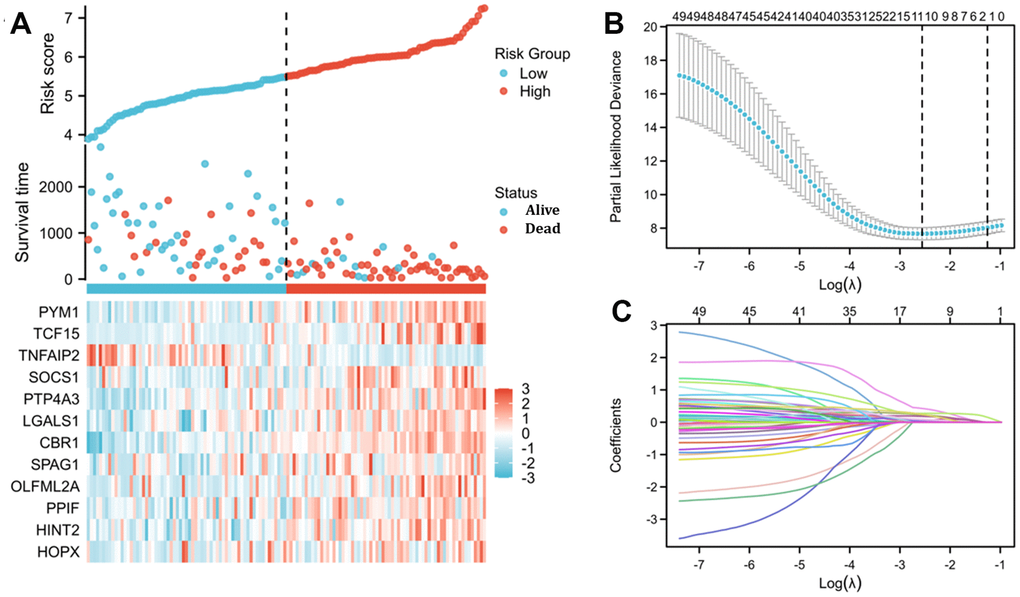
Figure 5.Risk score analysis and LASSO regression based on TNFAIP2-correlated genes by Cox regression analysis in patients with AML. (A) Risk score and survival time distributions and heatmaps of the expression levels of TNFAIP2-correlated genes in the TCGA database. (B) Cross-validation for tuning parameter screening for LASSO regression. (C) LASSO coefficient profiles.