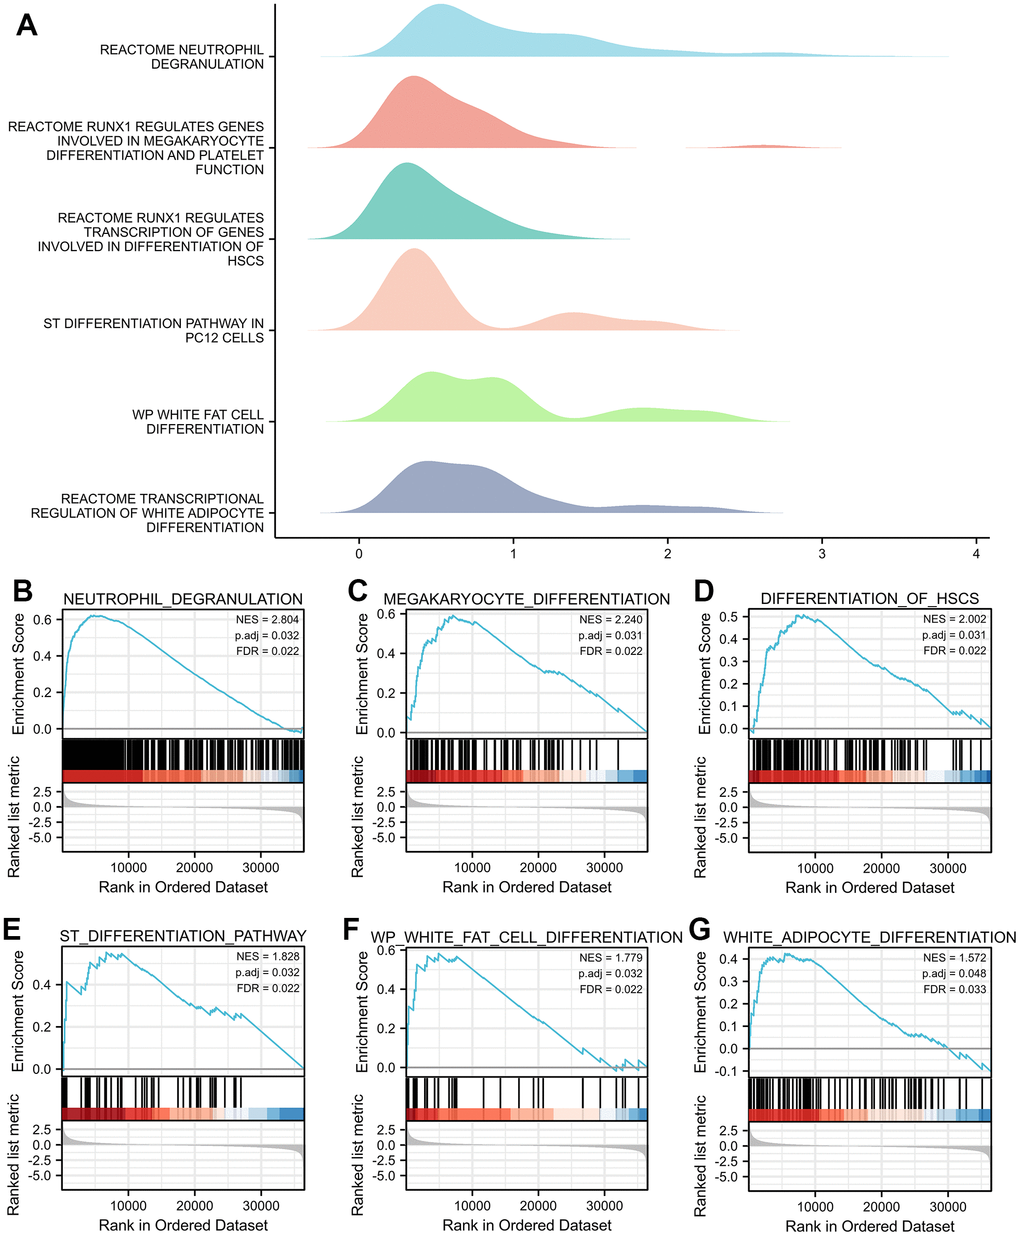
Figure 3.GSEA of genes correlated with TNFAIP2 in AML patients. (A) The ridge plot of the GSEA results of TNFAIP2-correlated genes revealed associations with multiple cell differentiation pathways. (B–G) Neutrophil, Megakaryocyte, Haematopoietic Stem Cell, Neural Stem Cell, White Fat Cell and White Adipocyte.