Submit an Article
Navigate
Home
Editorial Board
Editorial Policies
Current Volume
Archive
Scientific Integrity
Publication Ethics Statements
Interviews with Outstanding Authors
Newsroom
Sponsored Conferences
Podcast
Contact
Special Collections
Submit an Article
Online ISSN: 1945-4589
Research Paper
|
Volume 16, Issue 1
|
pp. 928–947
Mechanism of lysine oxidase-like 1 promoting synovial inflammation mediating rheumatoid arthritis development
Back to article
Figure 3
(3 of 11)
−
100%
+
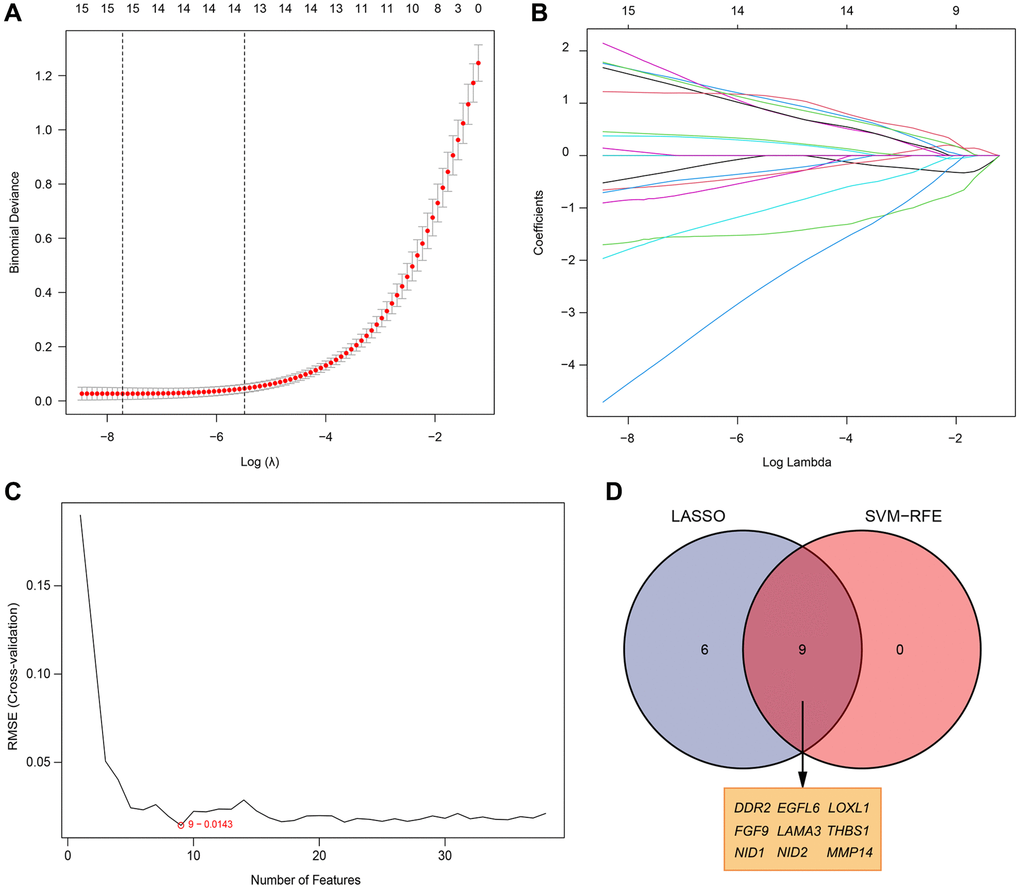
Figure 3.
Selection of diagnosis marker candidates for RA.
(
A
,
B
) LASSO regression model; (
C
) A plot of biological marker screening via the SVM-RFE arithmetic; (
D
) Venn graph displaying 9 diagnosis biomarkers shared by LASSO and SVM-RFE.