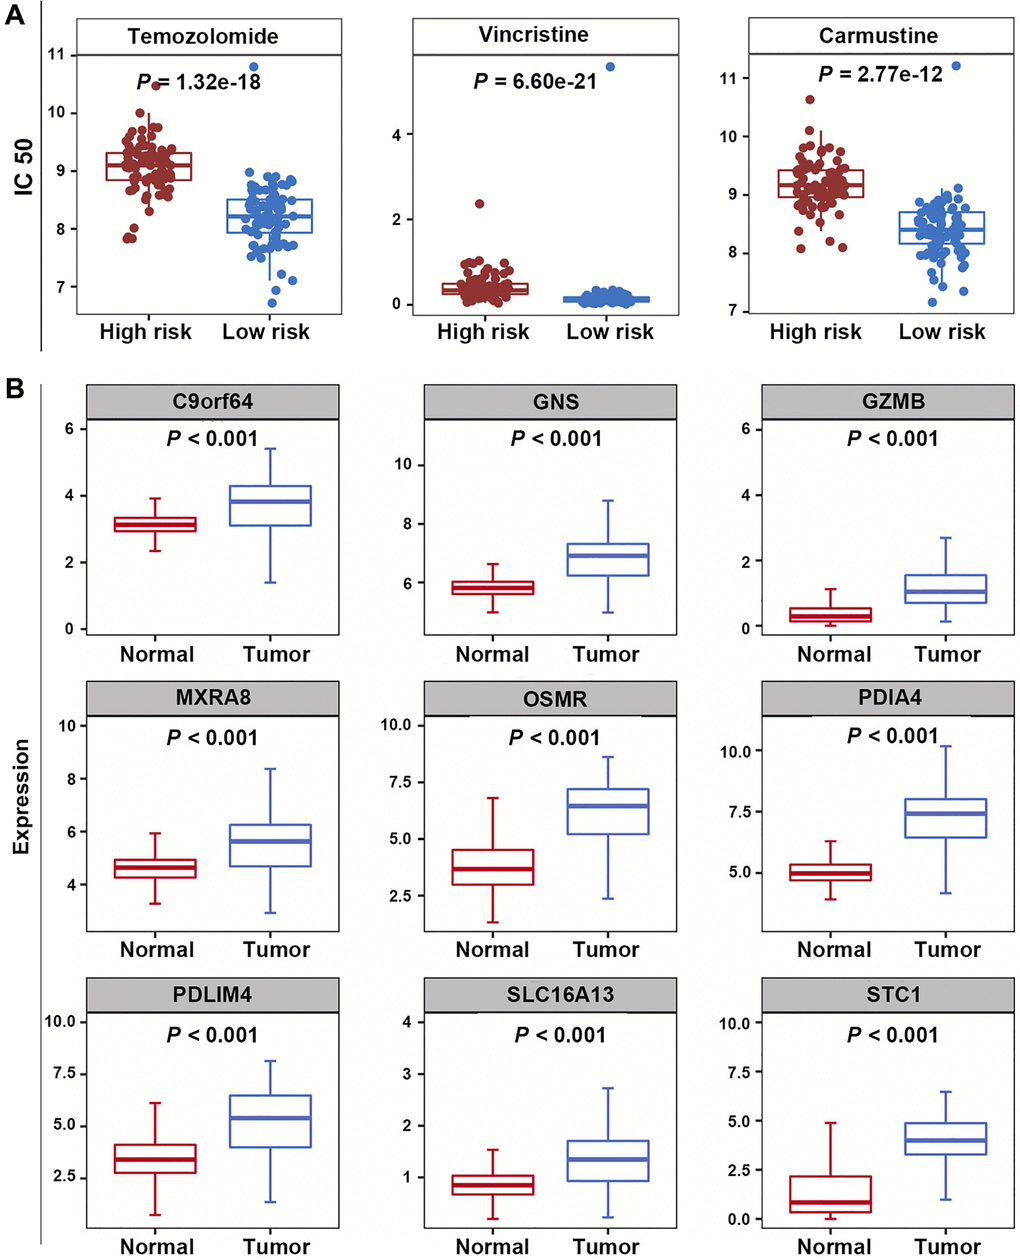
Figure 8.Correlation analysis of prognostic model and chemotherapeutic sensitivity, as well as expression analysis of PRGs. (A) The IC50 values for temozolomide, carmustine, and vincristine in the high-risk and low-risk groups. (B) The expression levels of nine PRGs.