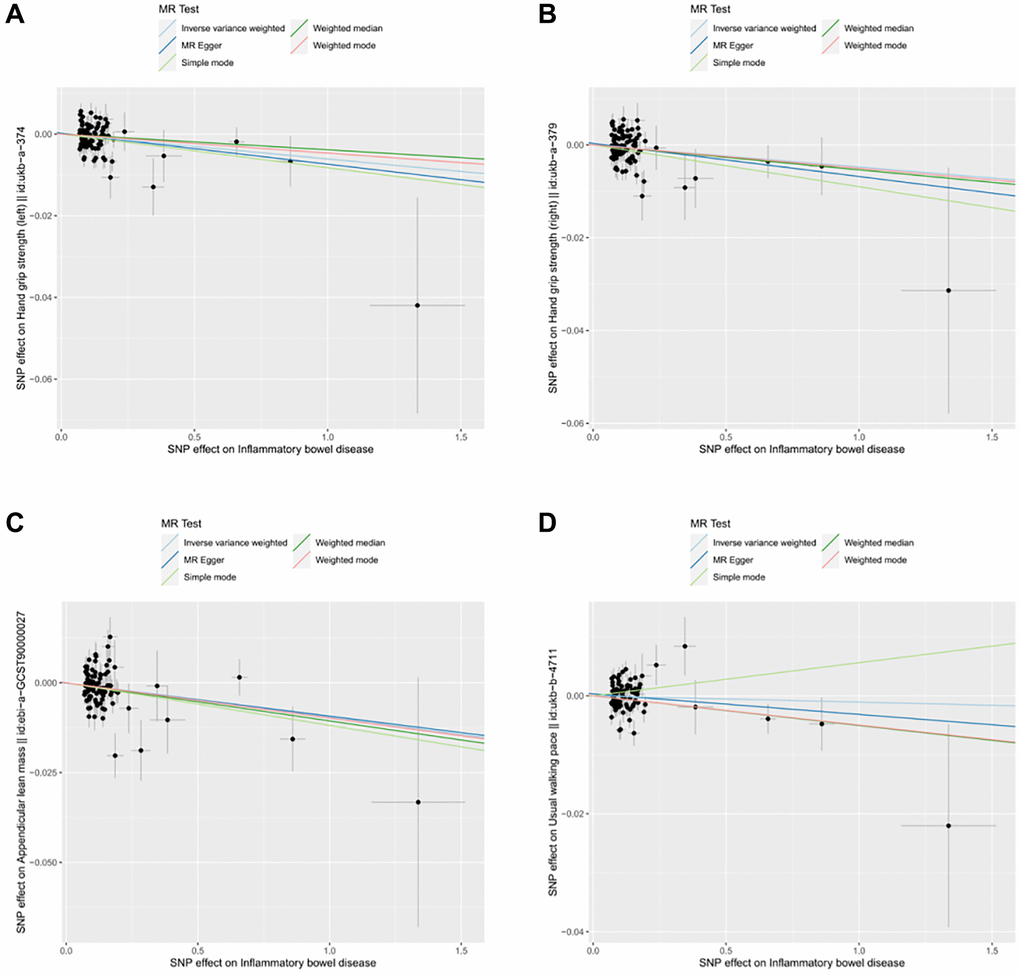
Figure 1.Scatter plot for MR analyses of the causal effect of IBD on sarcopenia after removing the pleiotropic outlier SNPs. (A) IBD-grip strength (left). (B) IBD-grip strength (right). (C) IBD-ALM. (D) IBD-Walking pace.
Figure 1 — Exploring the causal relationship between inflammatory bowel disease and sarcopenia-related traits: a two-sample Mendelian randomization analysis | Aging