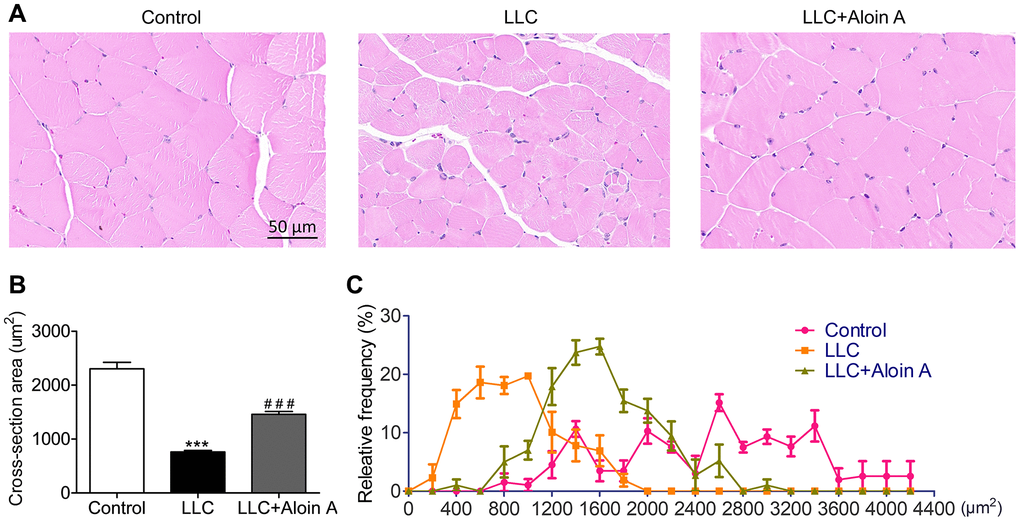
Figure 11.Effect of Aloin A on muscle histology in mice bearing lung tumor. (A) Representative images of hematoxylin and eosin (H&E) of transversal sections of the muscle. Scale bars: 50 μm. (B) The quantification of cross-sectional area (CSA) in muscle fibers. (C) Relative frequency of muscle fibers. The values are shown as the mean ± SEM (n = 3). ***P < 0.001 vs. the control group. ###P < 0.001 vs. the LLC group.