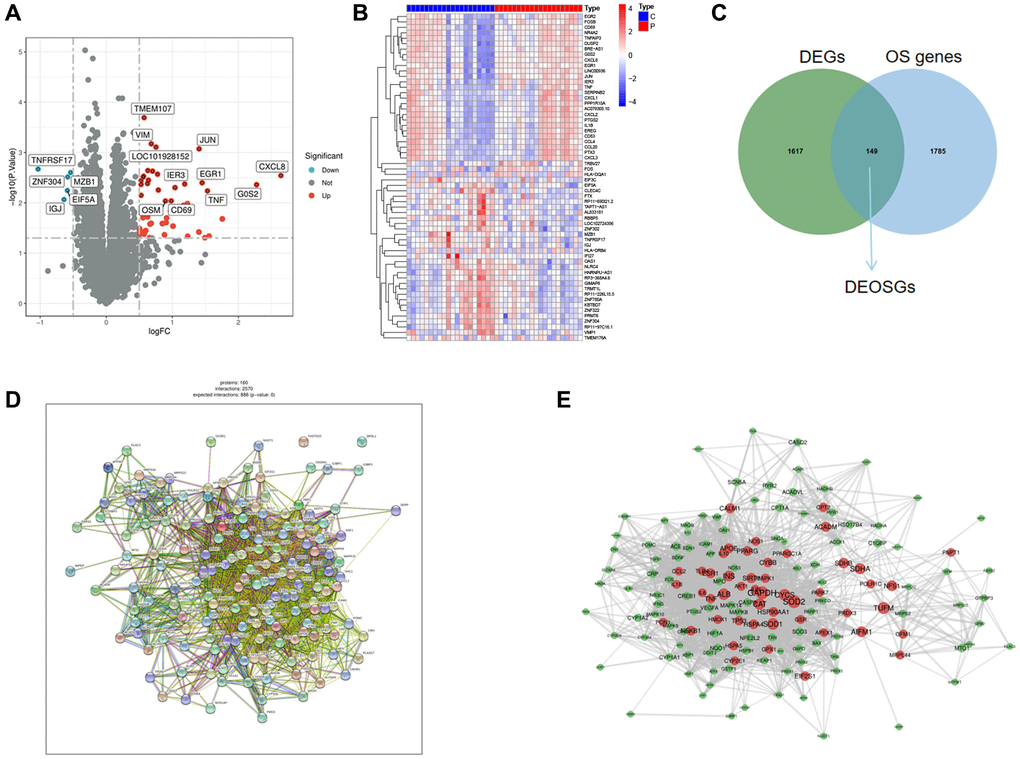
Figure 2.Identification of DEGs and DEOSGs. (A) Volcano plot of DEGs in GSE22255. (B) Heatmaps of DEGs in GSE22255. (C) Venn diagram shown the 149 overlaps of DEOSGs between DEGs in GSE22255 and OS genes. (D, E) PPI network of the 149 DEOSGs.
Figure 2 — Novel diagnostic biomarkers of oxidative stress, ferroptosis, immune infiltration characteristics and experimental validation in ischemic stroke | Aging