Submit an Article
Navigate
Home
Editorial Board
Editorial Policies
Current Volume
Archive
Scientific Integrity
Publication Ethics Statements
Interviews with Outstanding Authors
Newsroom
Sponsored Conferences
Podcast
Contact
Special Collections
Submit an Article
Online ISSN: 1945-4589
Research Paper
|
Volume 16, Issue 1
|
pp. 714–745
LAMP3 is a potent uterine corpus endometrial carcinoma prognostic biomarker associated with immune behavior
Back to article
Figure 10
(10 of 11)
−
100%
+
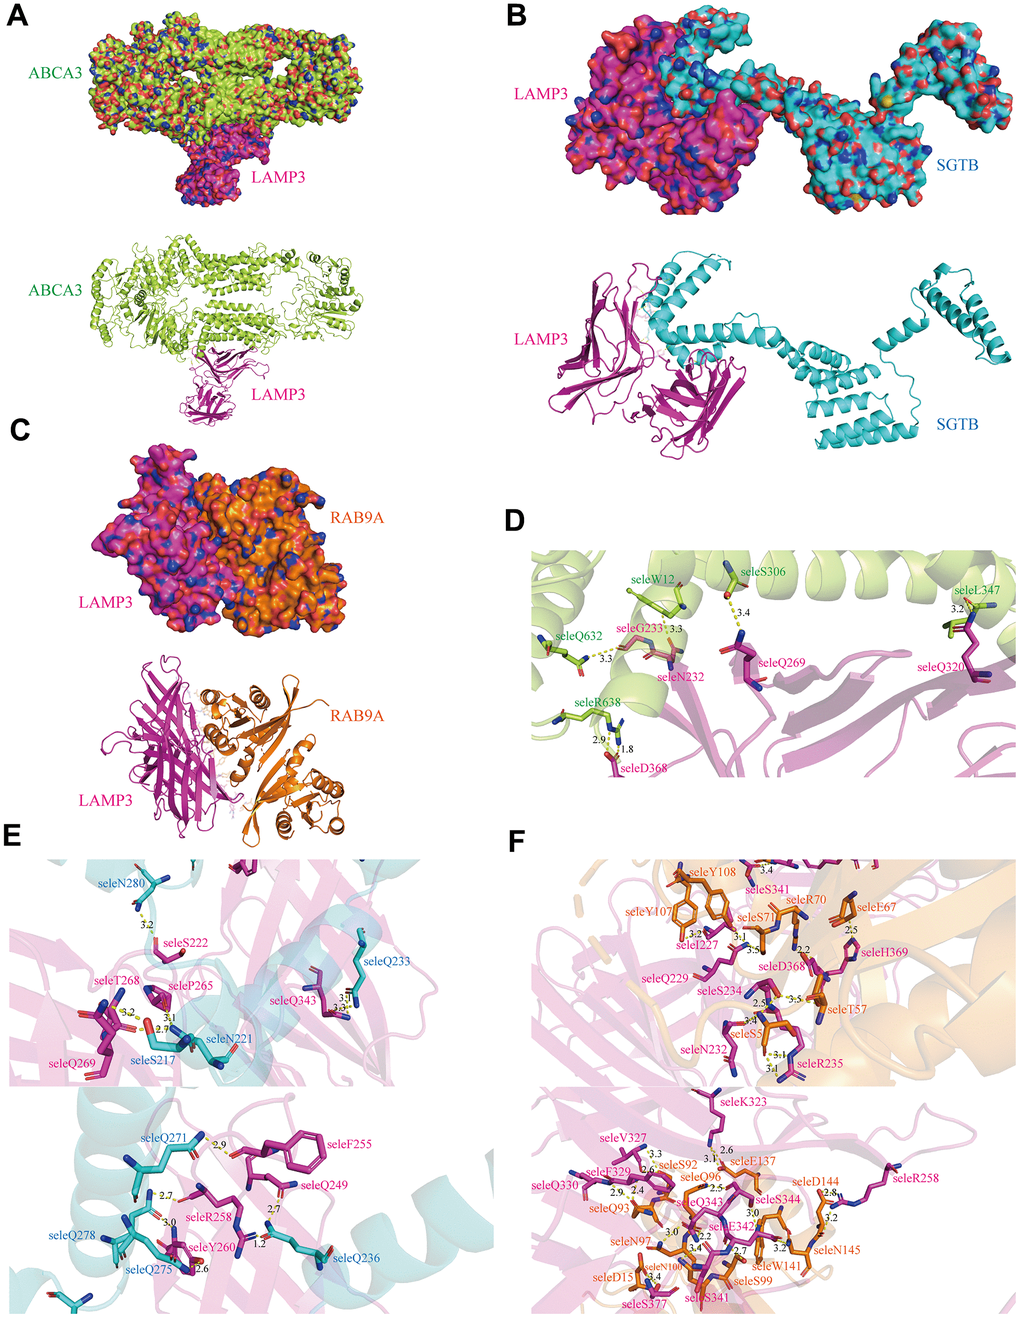
Figure 10.
Binding mode of LAMP3.
Cartoon view and surface view of (
A
) LAMP3-ABCA3 (
B
) LAMP3-SGTB (
C
) LAMP3-RAB9A molecular docking model, where LAMP3 is shown in pink. (
D
–
F
) Key regions that bind LAMP3 to ABCA3, SGTB and RAB9A, respectively.