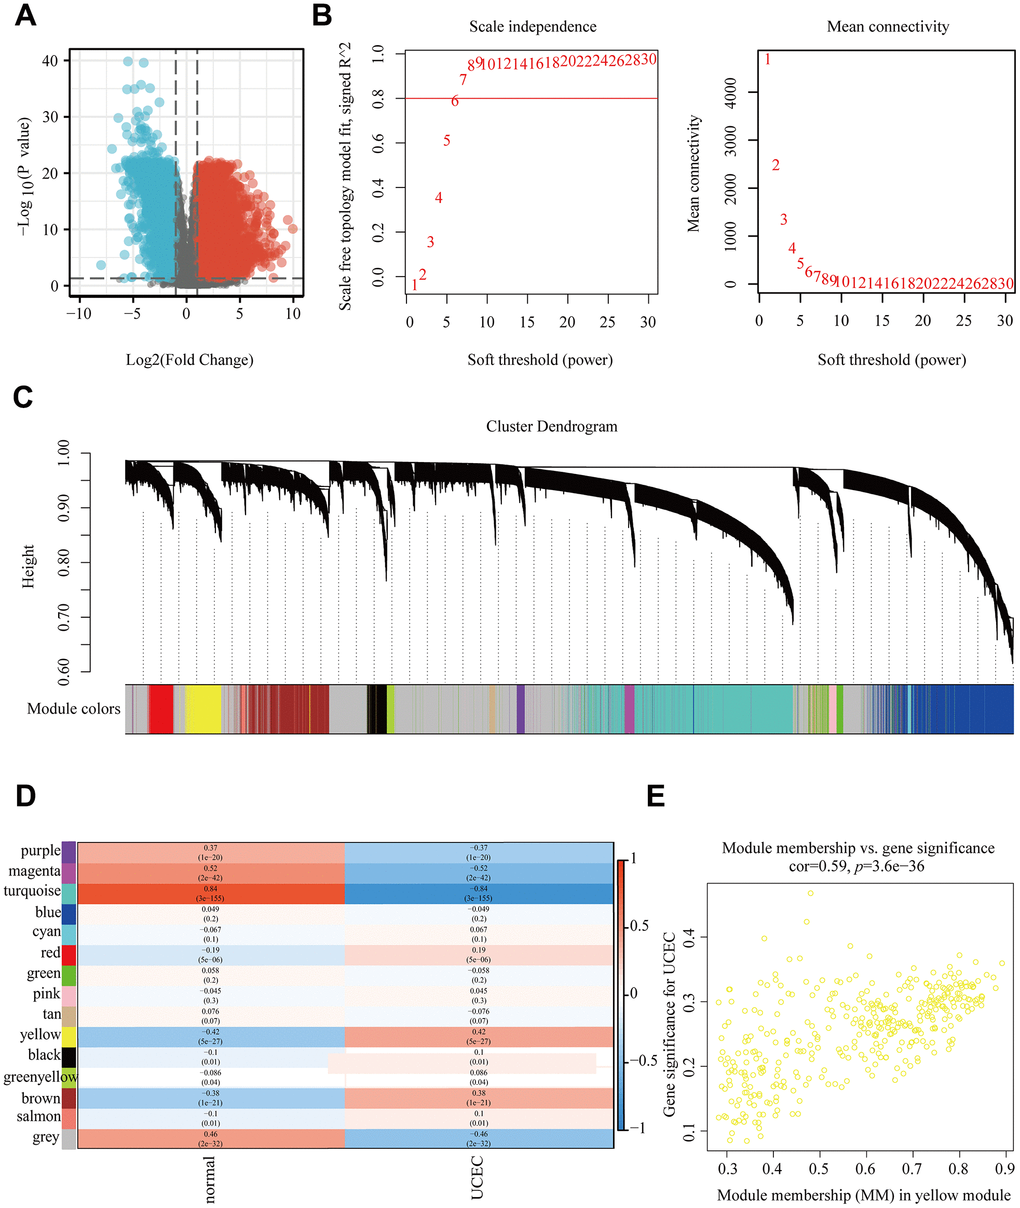
Figure 1.WGCNA based on TCGA-UCEC. (A) All differentially expressed genes in TCGA-UCEC. (B) Determination of soft threshold. (C) Tree diagram of 15 modules labeled with different colors. (D) Correlation between module feature genes and clinical traits. (E) Scatter plot of MM vs GS in the yellow module.