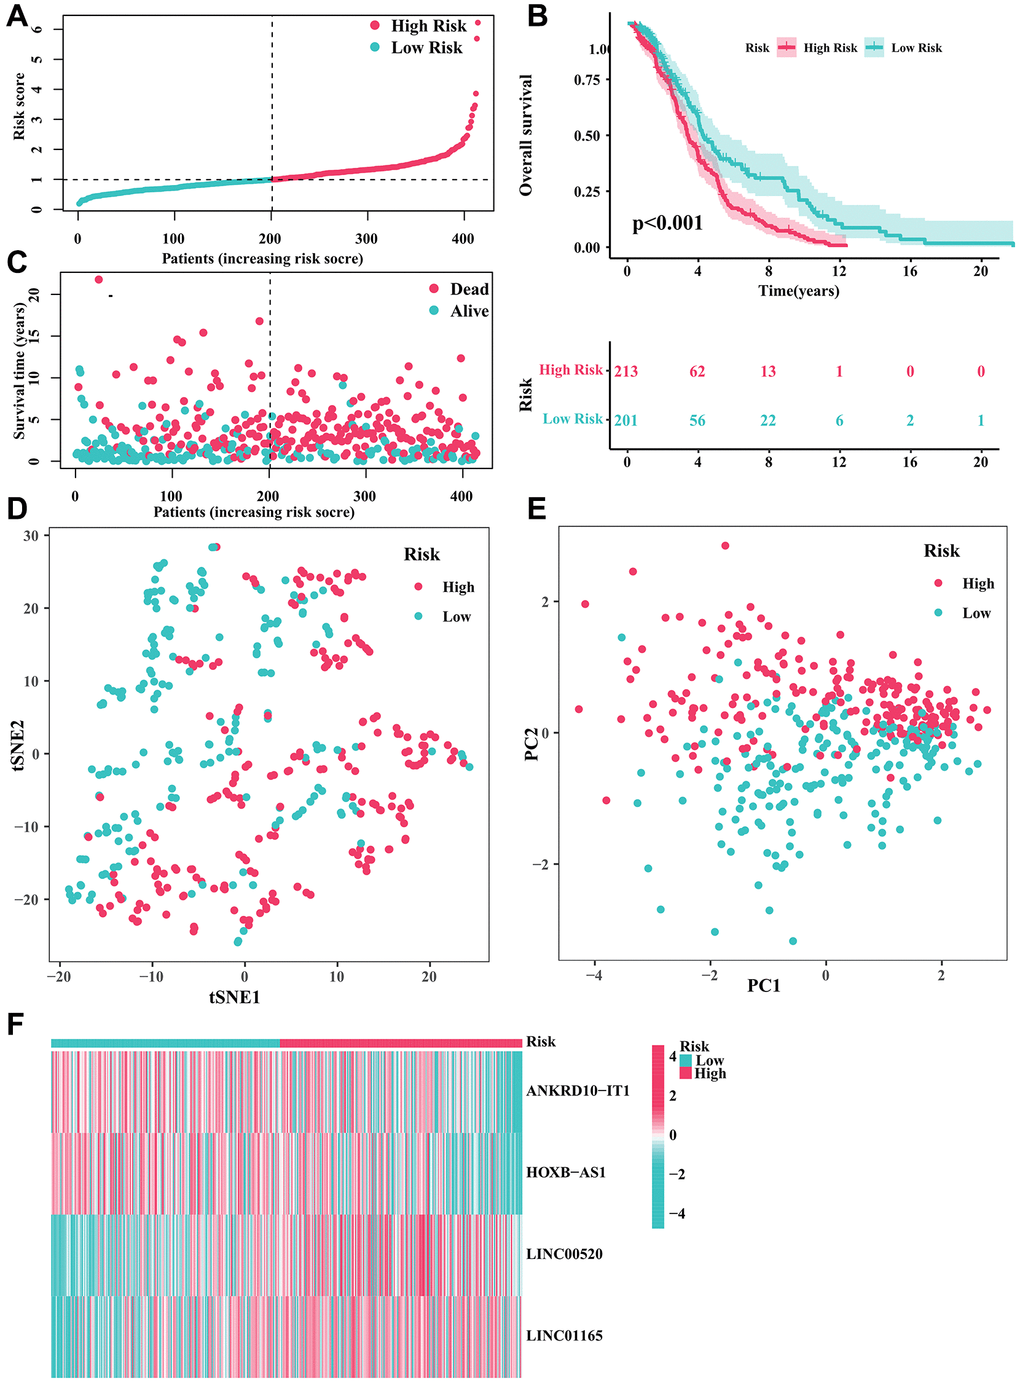
Figure 2.Developing a predictive risk model using the CRIRLs in DLBCL. (A) Distribution of the patients’ normalized risk score. (B) Analysis of clinical prognosis in low-risk and high-risk groups of DLBCL samples. (C) Patients’ survival status along with their risk score. (D) t-SNE analysis. (E) PCA analysis. (F) The heatmap diagram of the expression of 4 prognostic CRIRLs.