Submit an Article
Navigate
Home
Editorial Board
Editorial Policies
Current Volume
Archive
Scientific Integrity
Publication Ethics Statements
Interviews with Outstanding Authors
Newsroom
Sponsored Conferences
Podcast
Contact
Special Collections
Submit an Article
Online ISSN: 1945-4589
Research Paper
|
Volume 16, Issue 2
|
pp. 1192–1217
Gut microbial community and fecal metabolomic signatures in different types of osteoporosis animal models
Back to article
Figure 5
(5 of 6)
−
100%
+
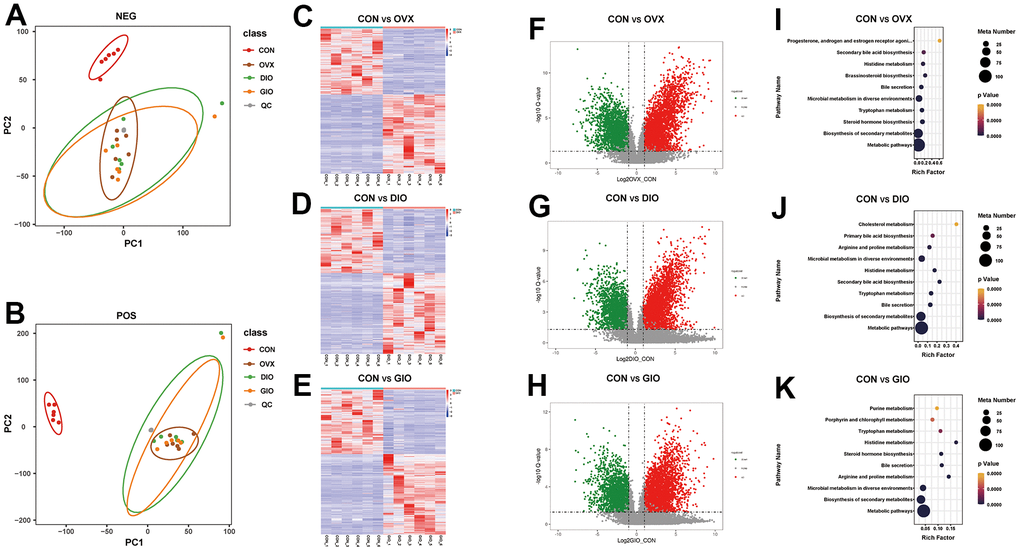
Figure 5.
(
A
,
B
) PCA of fecal metabolites. (
C
–
E
) Heat map of differential fecal metabolites. (
F
–
H
) Volcano map of differential fecal metabolites. (
I
–
K
) Bubble diagram of KEGG enrichment analysis; n = 6.
Figure 5 — Gut microbial community and fecal metabolomic signatures in different types of osteoporosis animal models | Aging