Submit an Article
Navigate
Home
Editorial Board
Editorial Policies
Current Volume
Archive
Scientific Integrity
Publication Ethics Statements
Interviews with Outstanding Authors
Newsroom
Sponsored Conferences
Podcast
Contact
Special Collections
Submit an Article
Online ISSN: 1945-4589
Research Paper
|
Volume 15, Issue 24
|
pp. 15535–15556
Potential impact of cuproptosis-related genes on tumor immunity in esophageal carcinoma
Back to article
Figure 4
(4 of 10)
−
100%
+
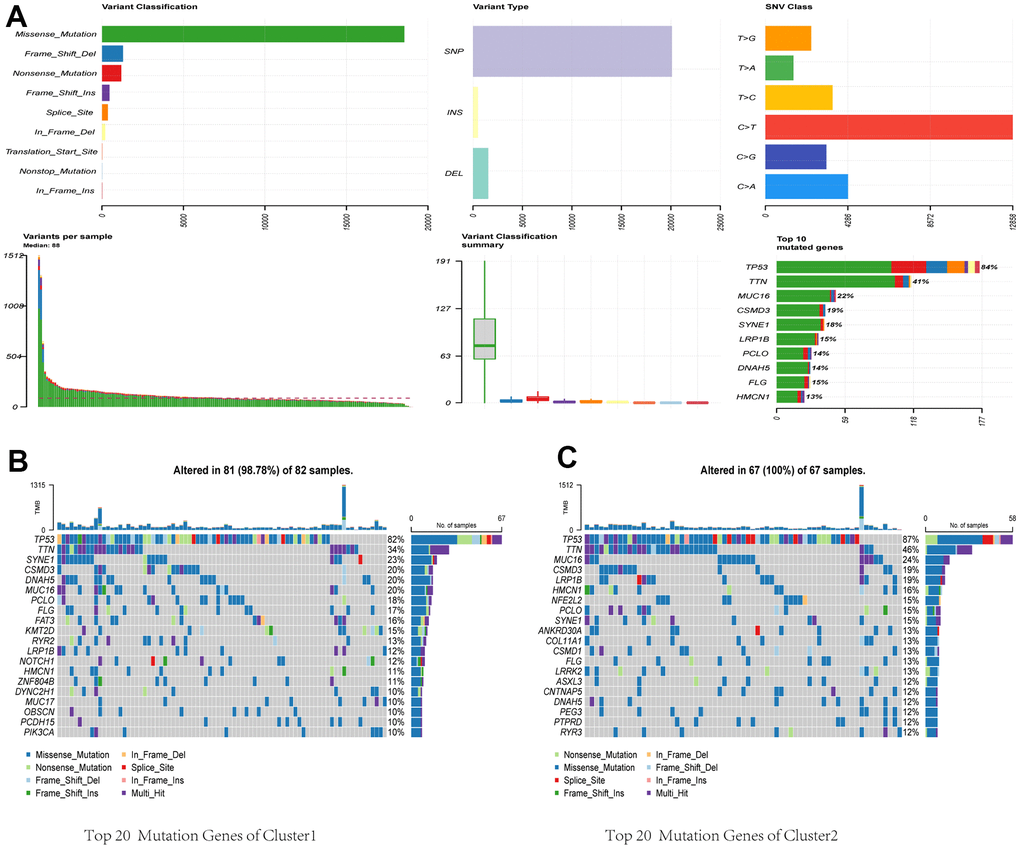
Figure 4.
Comparative analysis of mutational landscapes between two clusters.
(
A
) Overall mutational profile. Mutational landscape of Cluster 1 (
B
) and Cluster 2 (
C
).