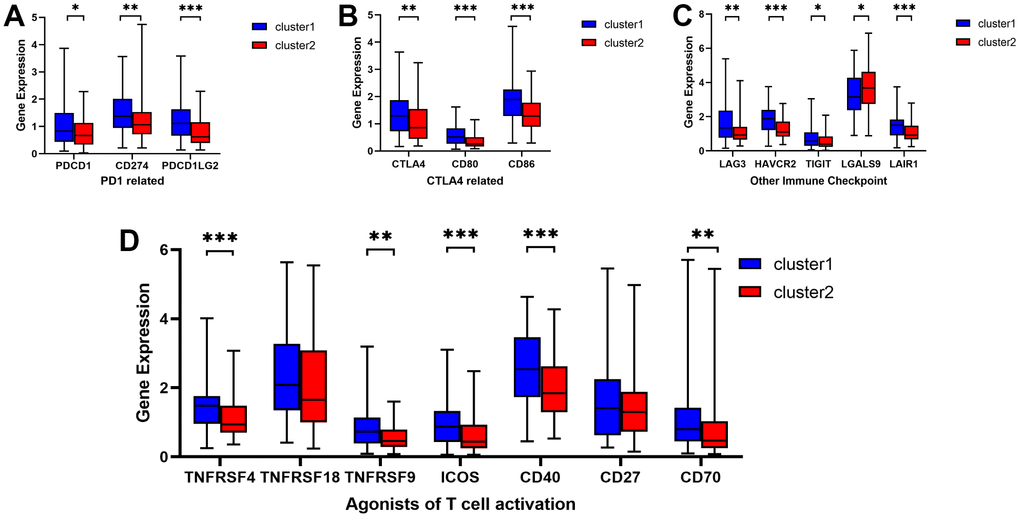
Figure 3.Comparative analysis of targets of immunomodulatory drugs in clinical trials for metastatic esophageal cancer between two clusters. The expression levels of immunomodulatory targets related to PD1 (A), CTLA4 (B), other immune checkpoint molecules (C), and agonists of T cell activation (D) varied between Cluster 1 and Cluster 2. *P < 0.05, **P < 0.01, ***P < 0.001.