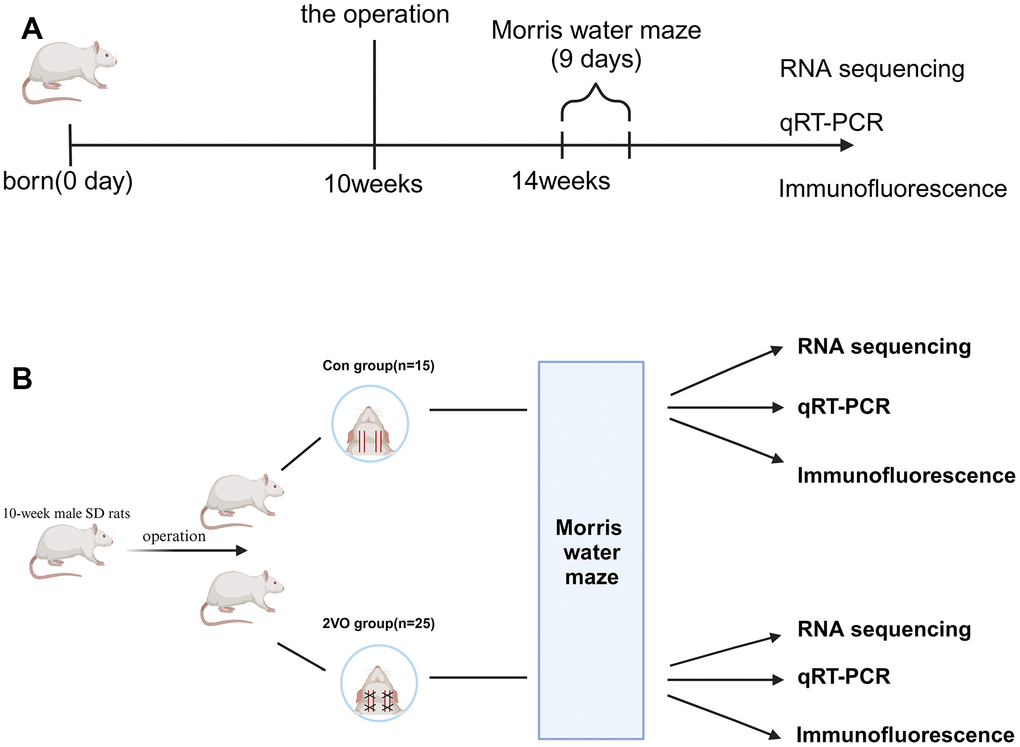
Figure 1.Schematic representation of the experimental arrangement for two groups of rats. (A) The timeline diagram of the experimental design; (B) The grouping and order of experimental arrangement. The Con group(n=15): the sham operation group, and the 2VO group(n=25): the bilateral common carotid arteries occlusion group.