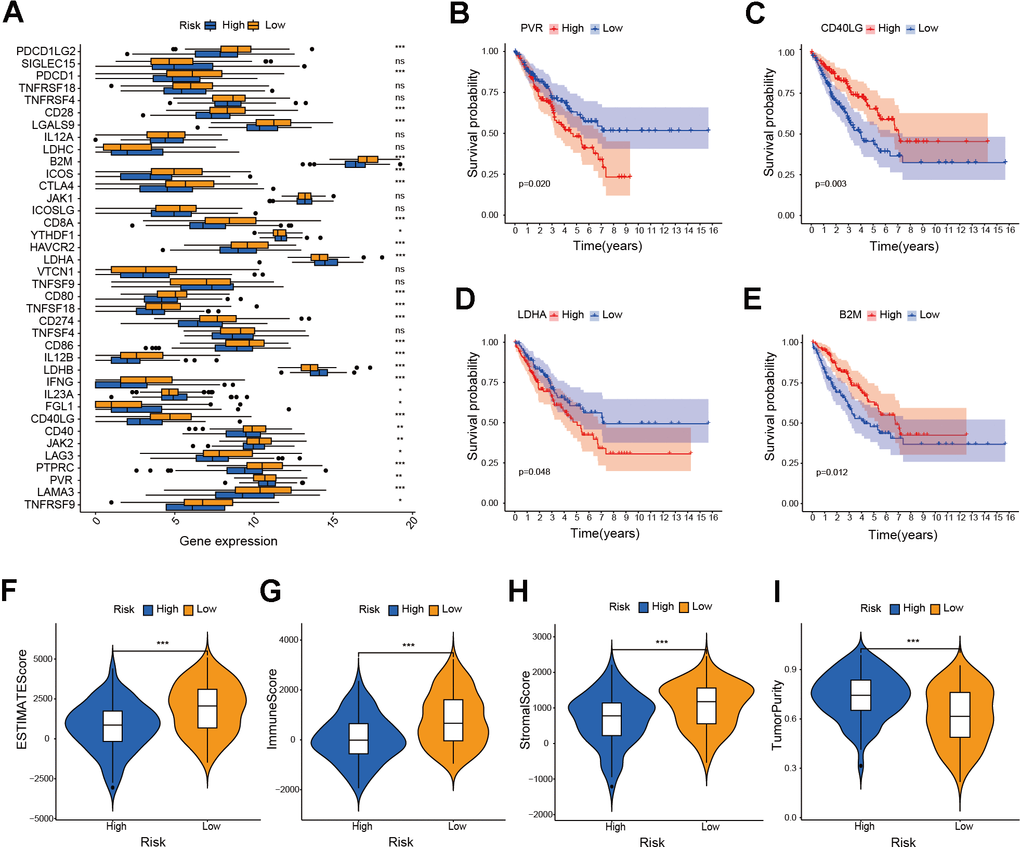
Figure 8.Investigation of ICPs and ESTIMATE score in risk model. (A) Analysis of immune checkpoint genes in the risk model (* P ≤ 0.05; ** P ≤ 0.01; *** P ≤ 0.001; ns, no significance). (B–E) Survival analysis of immune checkpoint genes in the risk model. (F–I) Analysis of ESTIMATE score, immune score, stromal score and tumor purity score in the risk model (*** P ≤ 0.001).