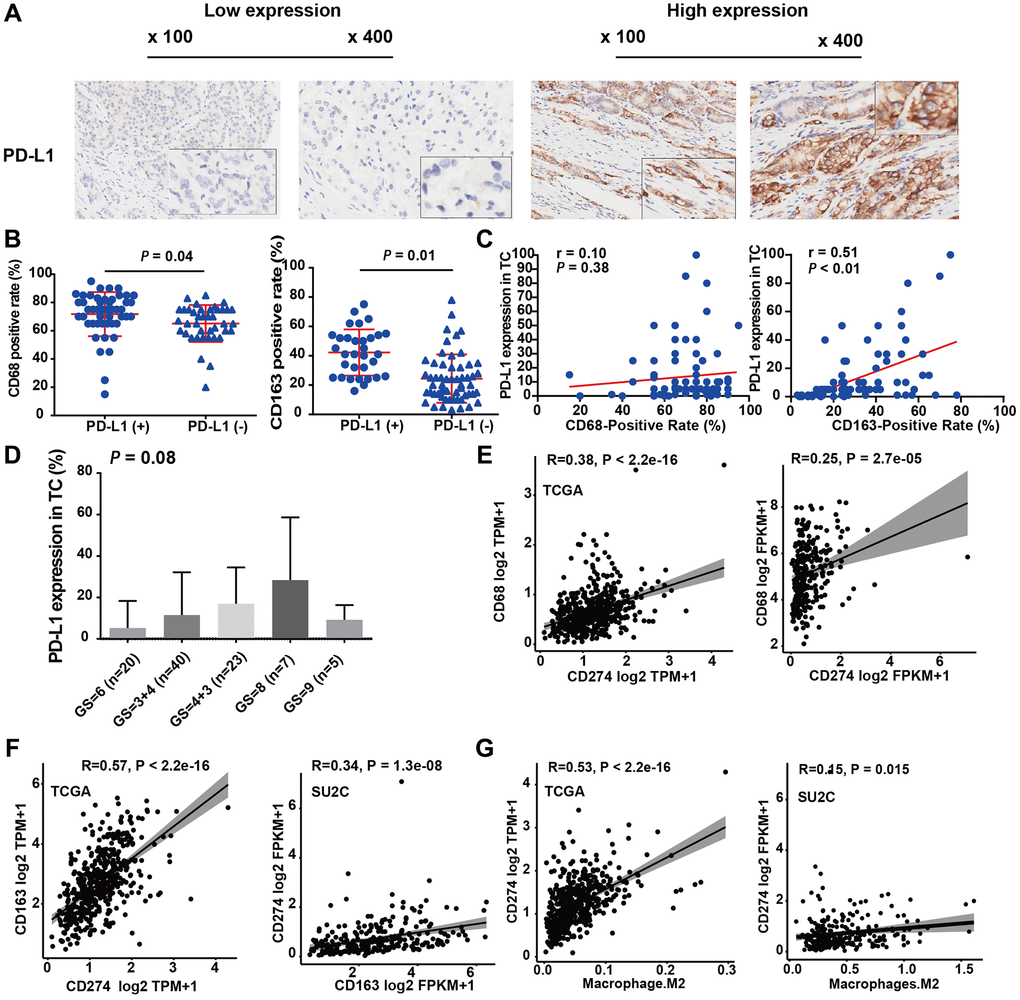
Figure 3.M2-TAMs infiltration was positively associated with PD-L1 expression. (A) Representative IHC images of PCa tissue slides with low (left panel) or high (right panel) levels of PD-L1 protein. (B) Dot plot shows the expression of CD68 in PD-L1 (+) and PD-L1 (−) PCa (Student’s t-test). (C) Dot plot shows the expression of CD163 in PD-L1 (+) and PD-L1 (−) PCa (Student’s t-test). (D) Bar plot showed PD-L1 protein expression increasing with Gleason score (ANOVA test). (E) Correlation between CD274 mRNA (encoding PD-L1) and CD68 mRNA in TCGA-PRAD and prad_su2c_2019 dataset. (F) Correlation between CD274 mRNA and CD163 mRNA in the two independent PCa datasets. (G) Correlation between the infiltration levels of M2 macrophages and the expression levels of CD274 mRNA in the two independent PCa datasets.