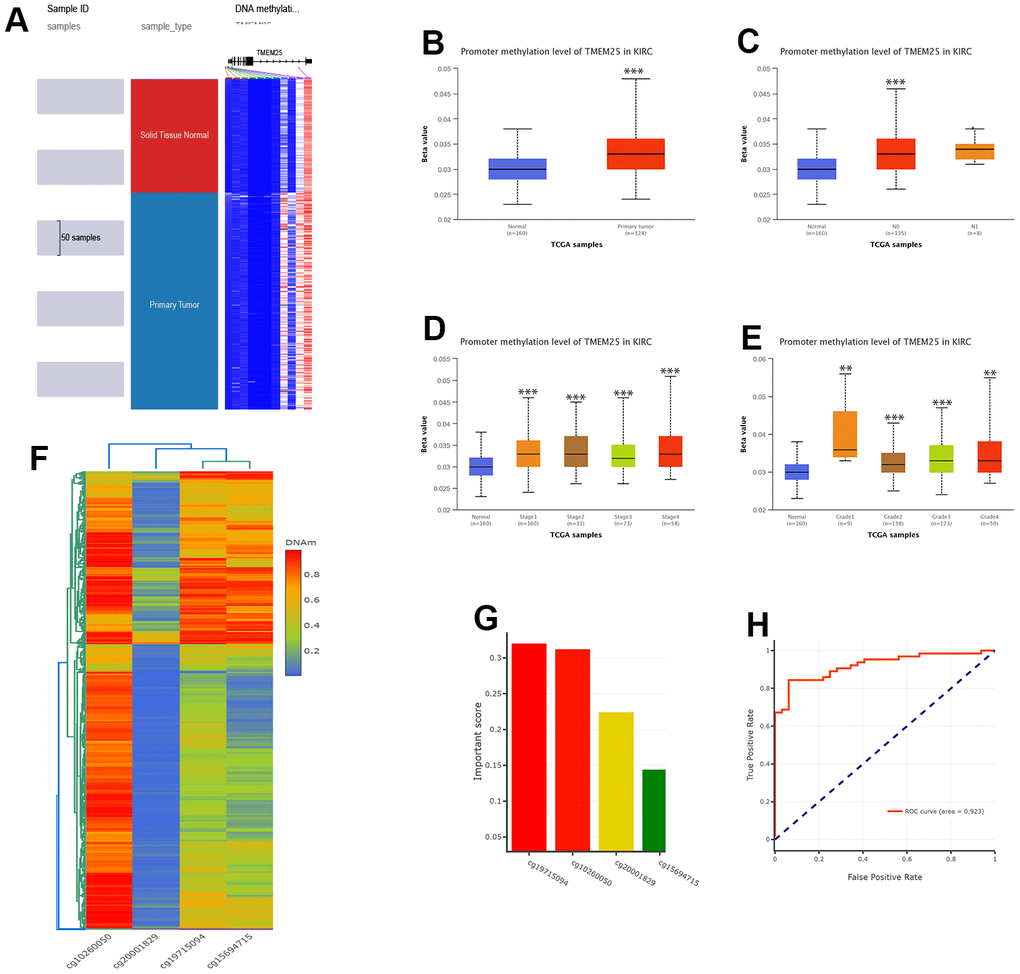
Figure 6.DNA methylation analysis of TMEM25 in ccRCC patients. (A–E) UCSC Xena and UALCAN websites revealed for us the TMEM25 DNA methylation expression levels in ccRCC in different states. (F, G) The DNMIVD database further demonstrated that the CpG loci in TMEM25 was associated with the diagnosis and prognosis of ccRCC patients and screened for an important role of the four CpG islands. (H) The ROC curves calculated from the diagnostic model consisting of these four CpG loci showed a strong ability to distinguish ccRCC from normal tissue. (**p < 0.01, ***p < 0.001).