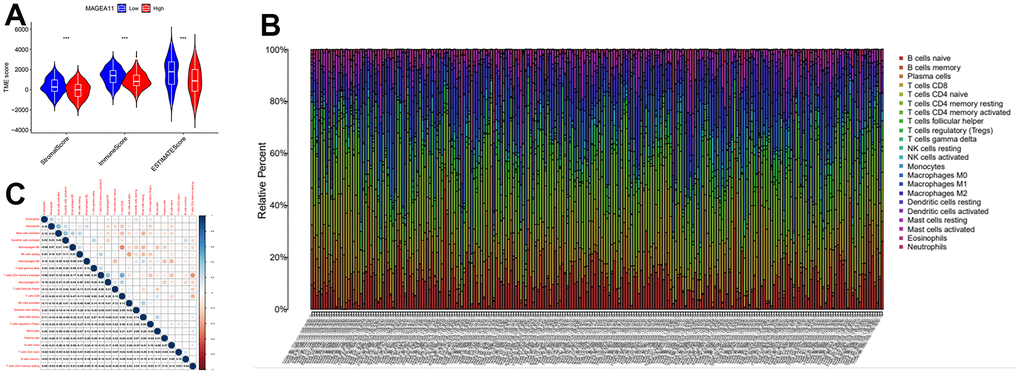
Figure 7.The relationship between MAGE-A11 expression and the tumour microenvironment. (A) Stromalscore, Immunescore and ESTIMATE score differences between MAGE-A11 high and low expression groups. (B) Proportion of tumor-infiltrating immune cells in each sample. (C) Relationship between tumor-infiltrating cells.