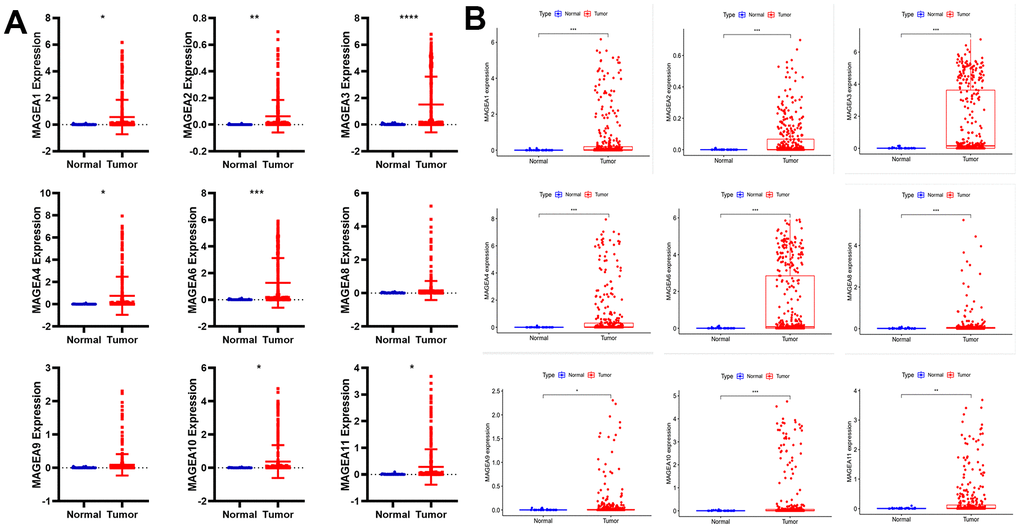
Figure 1.Differential expression analysis of MAGE-A family members between tumor and normal tissues. (A) Pan-cancer data analysis of MAGEA family members expression in gastric cancer. (B) Expression of MAGEA family members was analyzed from TCGA gastric cancer expression data.