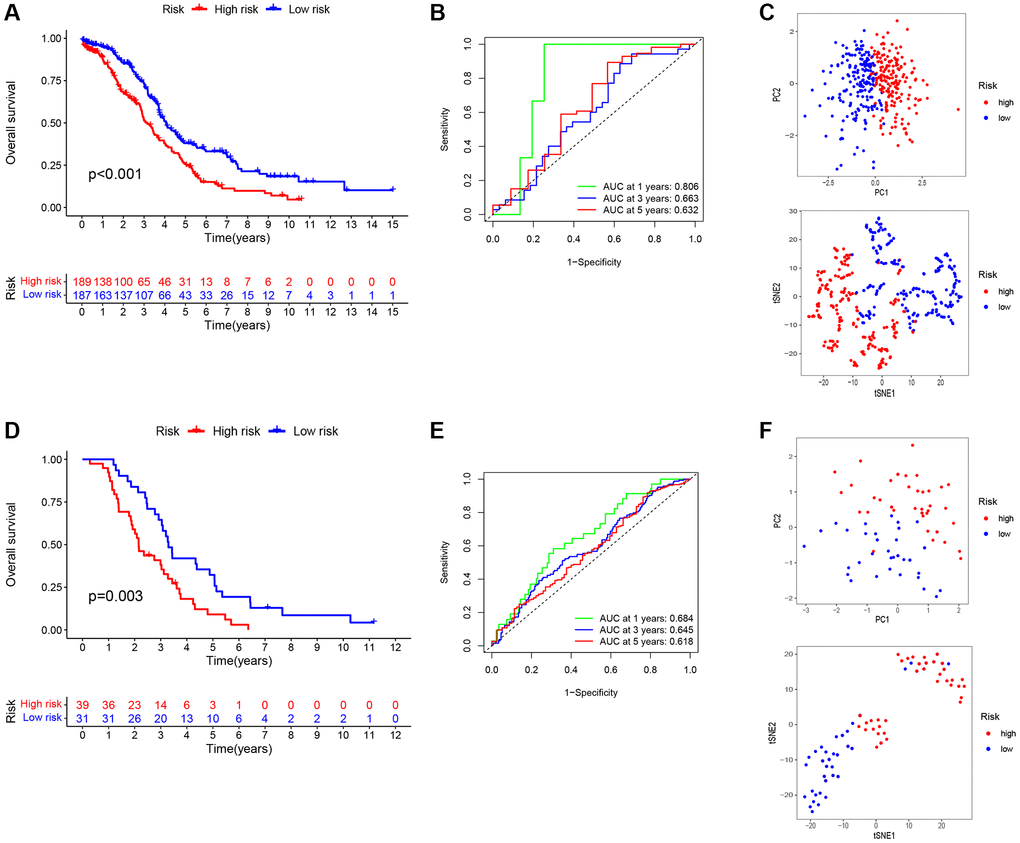
Figure 5.Construction and validation of a prognostic signatures model of TMAGs. (A) Kaplan-Meier survival curves for the training set. (B) ROC analysis of the training set. (C) PCA (above) and t-SNE (below) analysis of the training set. (D) Kaplan-Meier survival curves for the validation set. (E) ROC analysis of the validation set. (F) PCA (above) and t-SNE (below) analysis of the validation set.