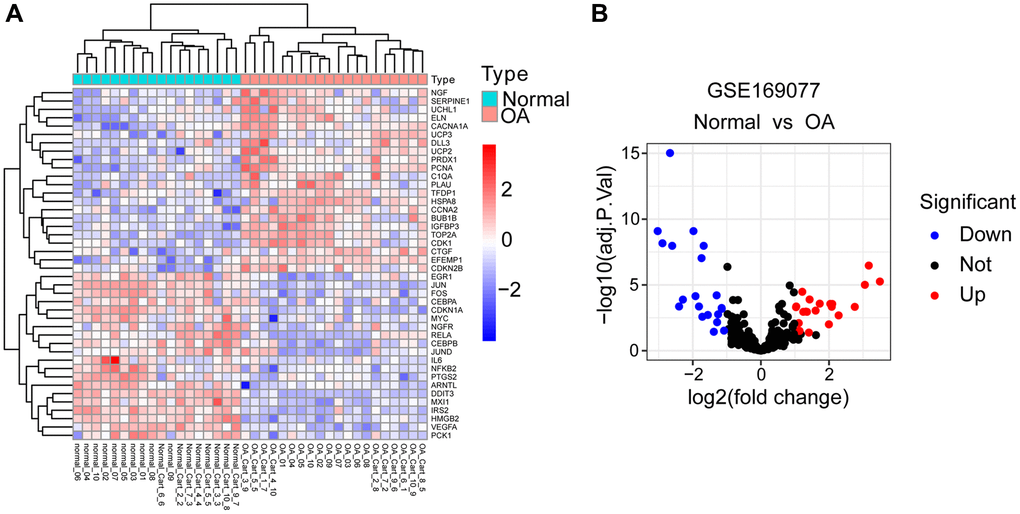
Figure 2.Identification of DEARGs. (A) Heatmap of DEARGs between normal and OA cartilage tissues. (B) Volcano plot for DEARGs between normal and OA cartilage tissues. Red square/plots represent up-regulated genes and blue square/plots represent down-regulated genes.