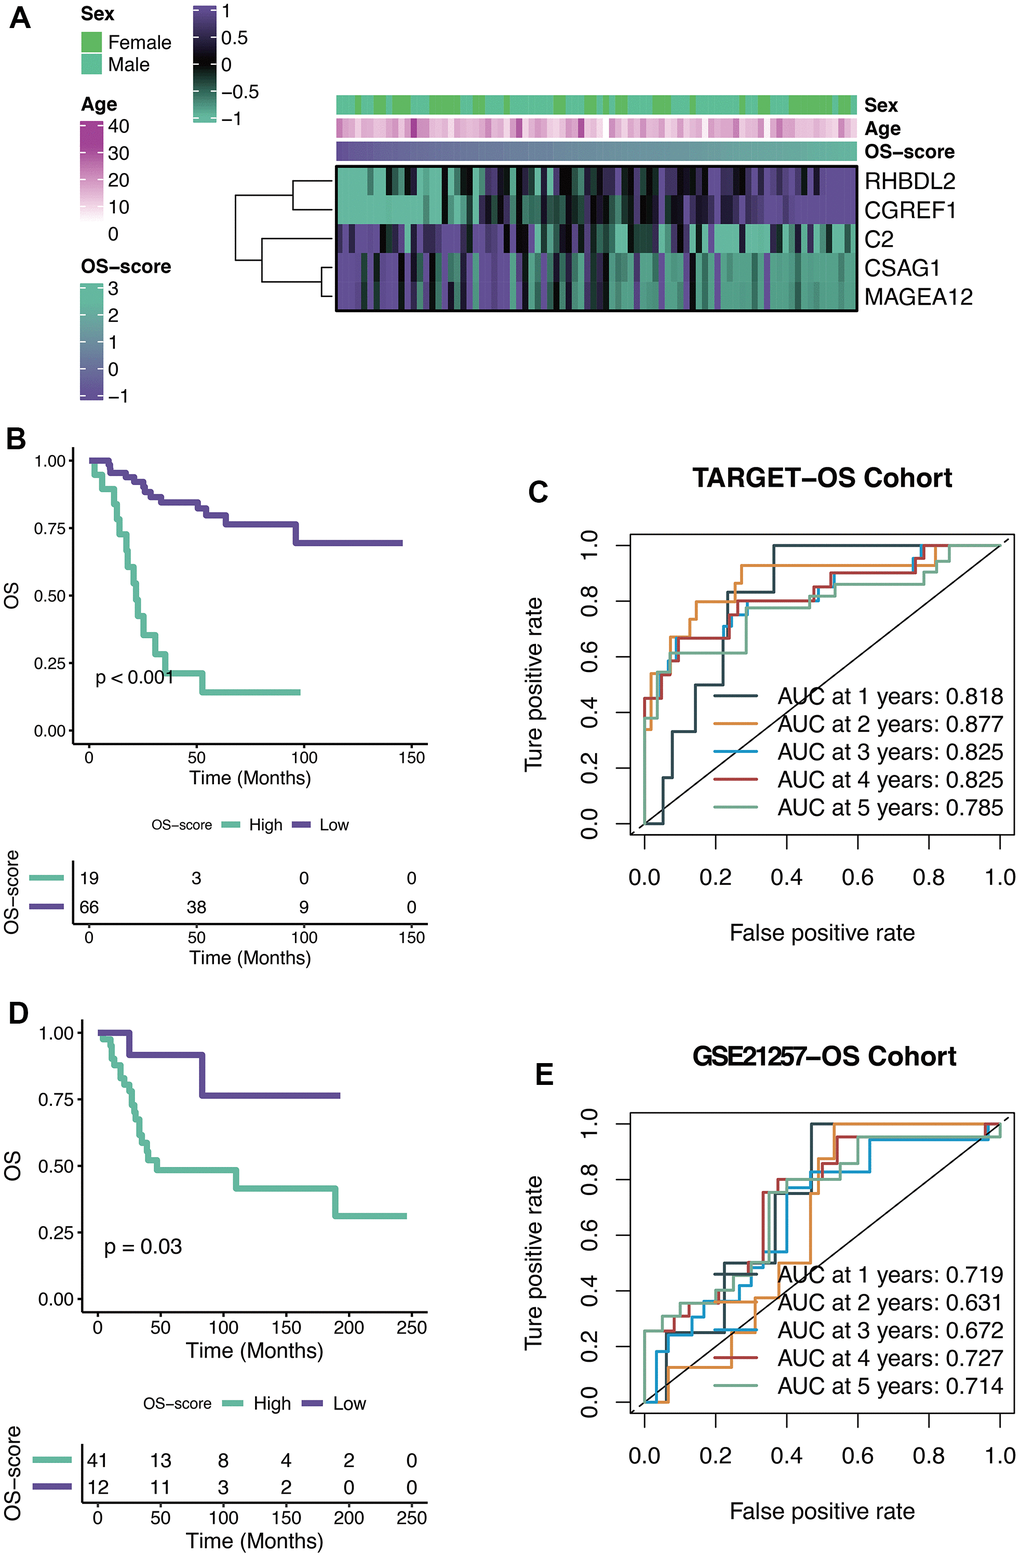
Figure 4.Efficacy of OXS-signature for OS. (A) Heat map showing the relationship between five genes (RHBDL2, CGREF1, C2, CSAG1, and MAGEA12) in the OXS-signature and OS-scores distribution and its clinical characteristics; (B) Kaplan-Meier survival curve showing survival probability of high-OS-score or low-OS-score subgroups for TARGET-OS cohort, with the green curve representing the group with higher OS-scores, and the purple curve representing the group with lower OS-scores; (C) The 1-year, 2-year, 3-year, 4-year, and 5-year survival ROC curves predicted by the OXS-signature for TARGET-OS cohort, with curves in different colors referring to the AUC for different years; (D) Kaplan-Meier survival curve showing survival probability of high-OS-score or low-OS-score subgroups for GSE21257-OS cohort, with the green curve indicating the group with higher OS-scores, and the purple curve indicating the group with lower OS-scores; (E) The 1-year, 2-year, 3-year, 4-year, and 5-year survival ROC curves predicted by the OXS-signature for GSE21257-OS cohort, with curves in different colors representing the AUC for different years.