Submit an Article
Navigate
Home
Editorial Board
Editorial Policies
Current Volume
Archive
Scientific Integrity
Publication Ethics Statements
Interviews with Outstanding Authors
Newsroom
Sponsored Conferences
Podcast
Contact
Special Collections
Submit an Article
Online ISSN: 1945-4589
Research Paper
|
Volume 15, Issue 24
|
pp. 15340–15359
Analysis of cancer-associated fibroblasts in cervical cancer by single-cell RNA sequencing
Back to article
Figure 2
(2 of 12)
−
100%
+
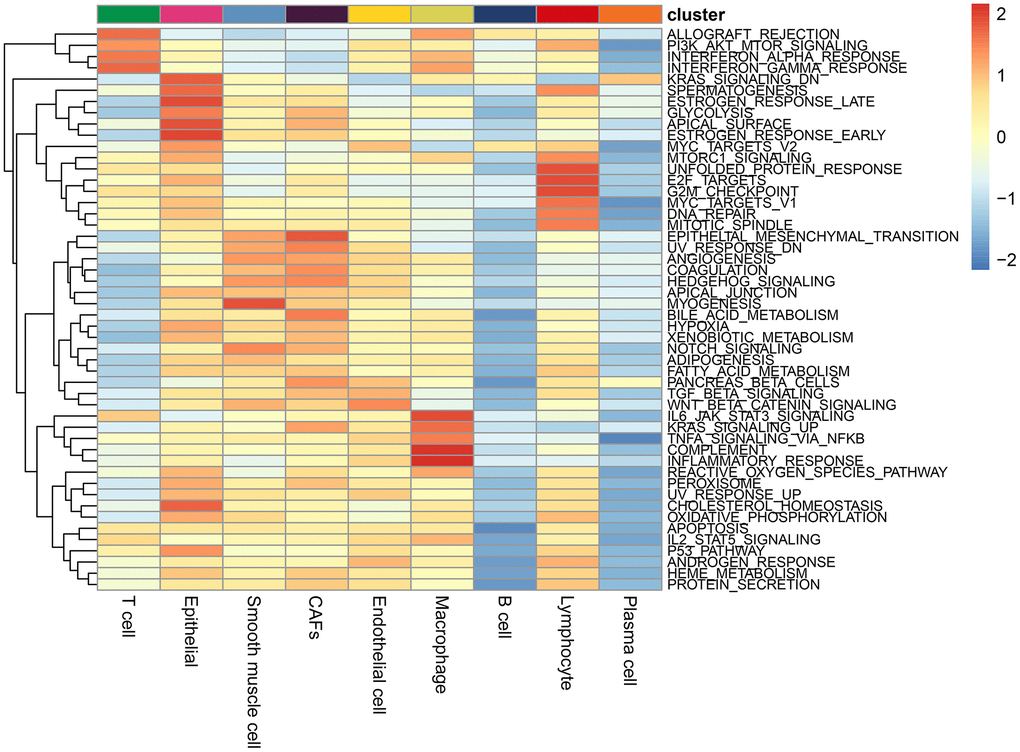
Figure 2.
Enrichment pathways in each cell type.
The colours represent the enrichment of the pathways, with the pathway enrichment increasing from blue to red.