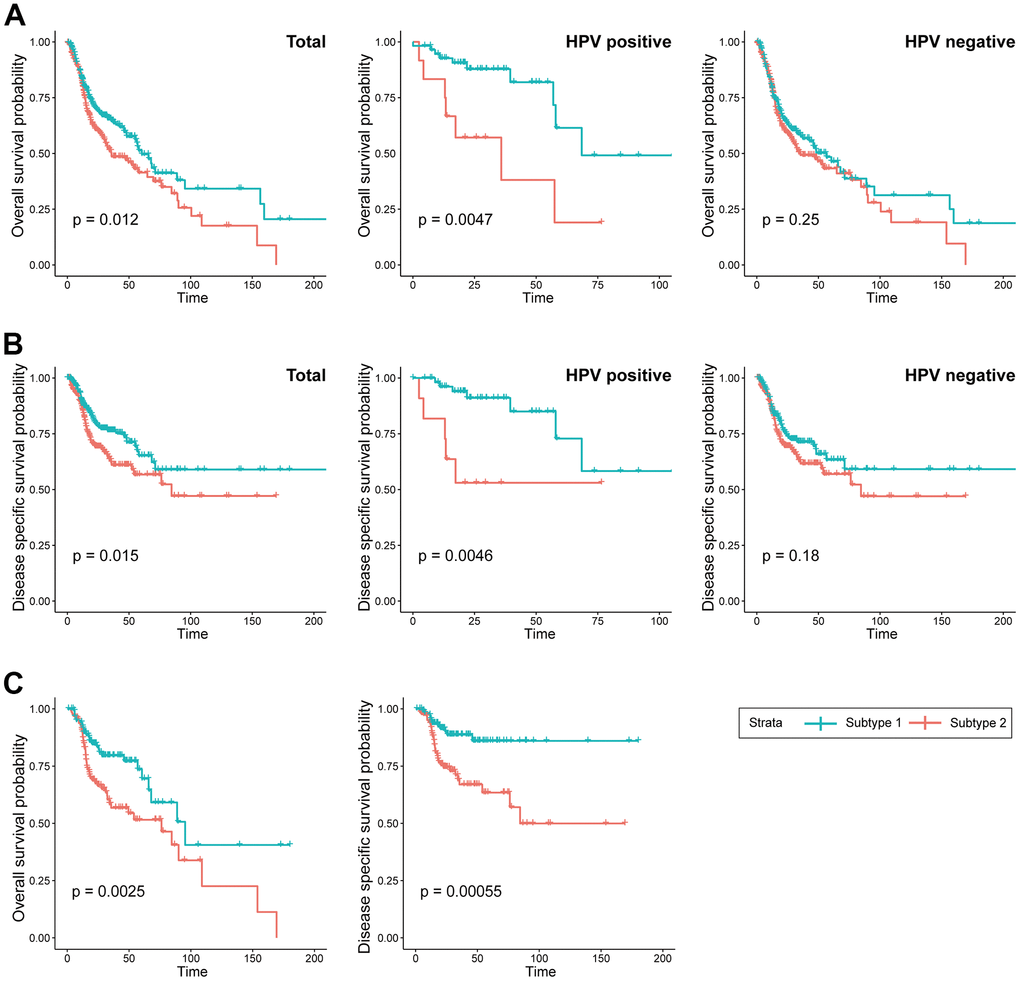
Figure 3.Prognostic difference between the two subtypes. (A) KM curves indicating prognostic differences in overall survival between the two subtypes in the TCGA-HNSC cohort (Left; total, Middle; HPV positive cohort, Right; HPV negative). (B) KM curves indicating prognostic differences in disease specific survival between the two subtypes in the TCGA-HNSC cohort (Left; total, Middle; HPV positive cohort, Right; HPV negative). (C) KM curves indicating prognostic differences in overall survival and disease specific survival between the two subtypes in the TCGA-HNSC cohort subgroup who received radiotherapy.