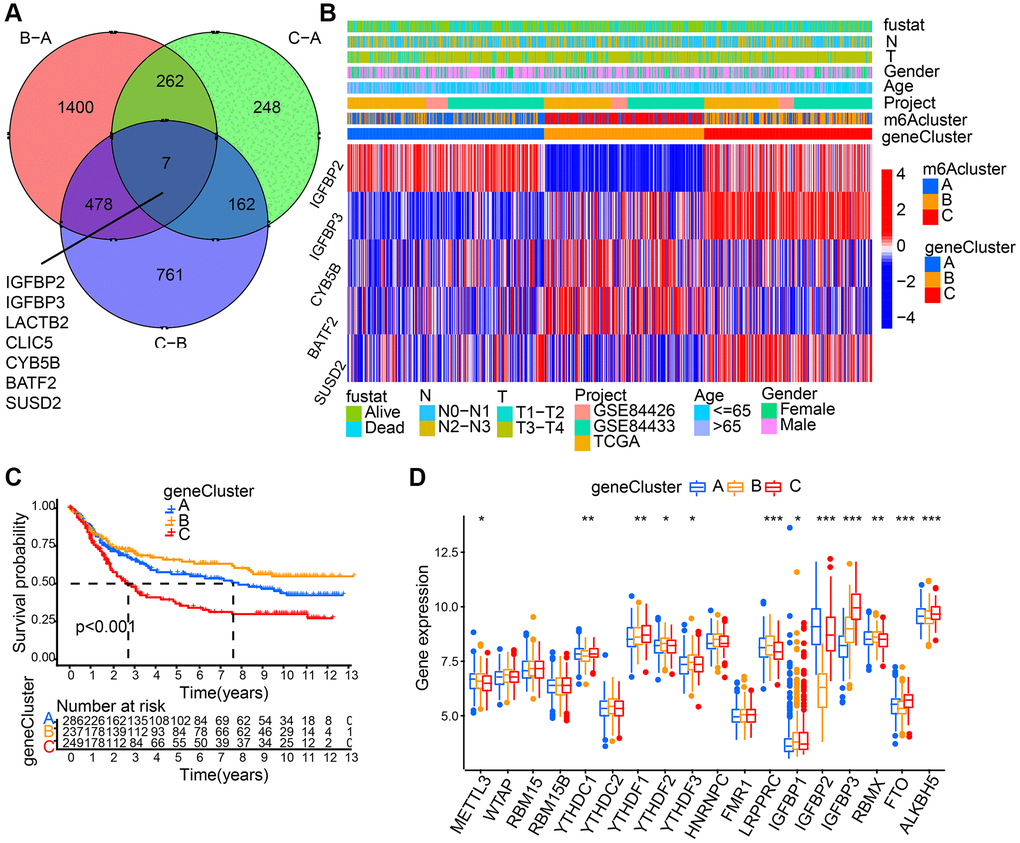
Figure 4.Generation of m6A gene signatures. (A) 7 m6A phenotype-associated genes shown in Venn diagram. (B) 5 m6A phenotype-associated genes (IGFBP2, IGFBP3, CYB5B, BATF2, and SUSD2) with the significant prognosis were used to classify patients into different genomic subtypes, termed as m6A gene cluster (A–C), respectively. The last 5 rows mean IGFBP2, IGFBP3, CYB5B, BATF2, and SUSD2, respectively. (C) Survival analyses for the three gene cluster. (D) The expression of 18 m6A regulators in three gene cluster. The asterisks represented the statistical p value (*P < 0.05; **P < 0.01; ***P < 0.001).