Submit an Article
Navigate
Home
Editorial Board
Editorial Policies
Current Volume
Archive
Scientific Integrity
Publication Ethics Statements
Interviews with Outstanding Authors
Newsroom
Sponsored Conferences
Podcast
Contact
Special Collections
Submit an Article
Online ISSN: 1945-4589
Research Paper
|
Volume 15, Issue 24
|
pp. 15025–15049
The efficacy of immune checkpoint inhibitors is limited in elderly NSCLC: a retrospective efficacy study and meta-analysis
Back to article
Figure 4
(4 of 4)
−
100%
+
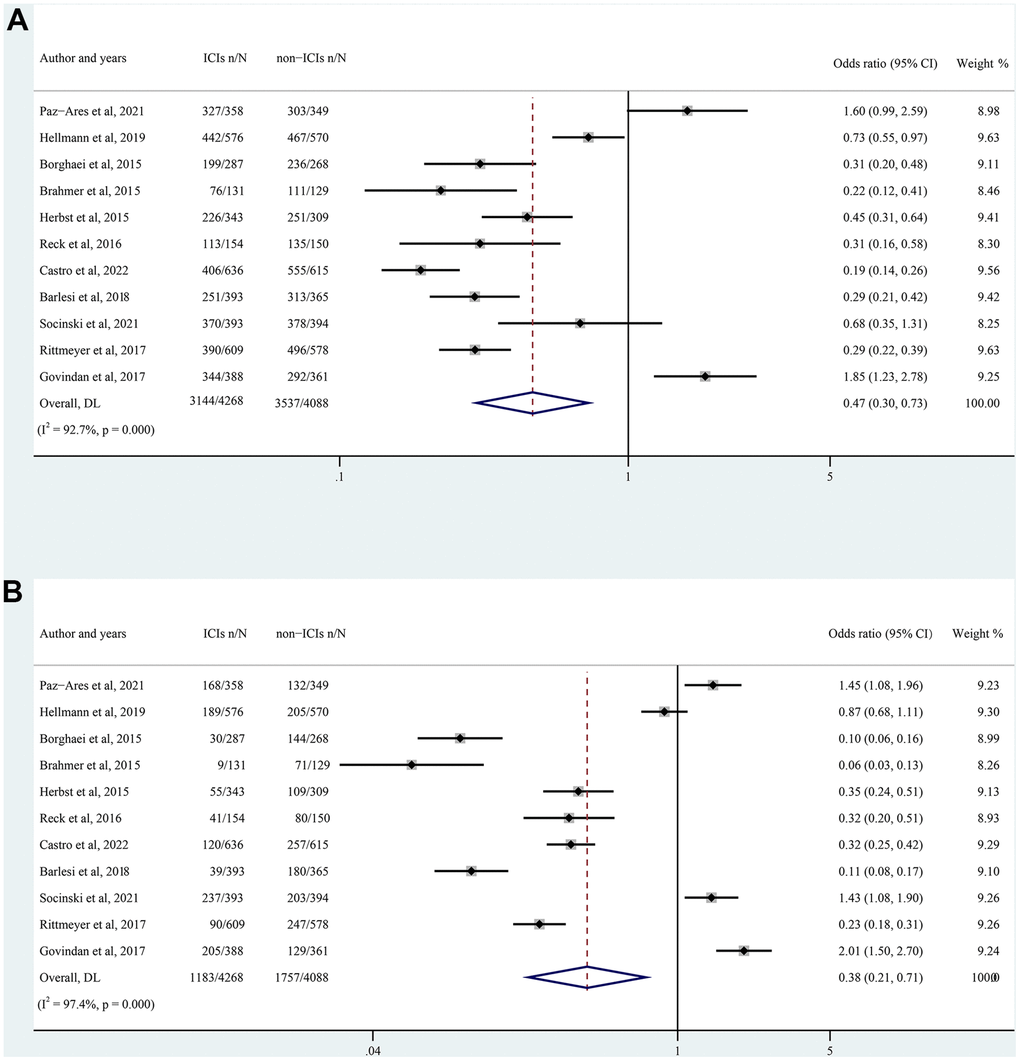
Figure 4.
Forest plot of all-grade (
A
) and high-grade (
B
) TRAEs in NSCLC patients treated with ICIs versus non-ICIs. CI, confidence interval; TRAEs, treatment-related adverse events; ICIs, immune checkpoint inhibitors.
Figure 4 — The efficacy of immune checkpoint inhibitors is limited in elderly NSCLC: a retrospective efficacy study and meta-analysis | Aging