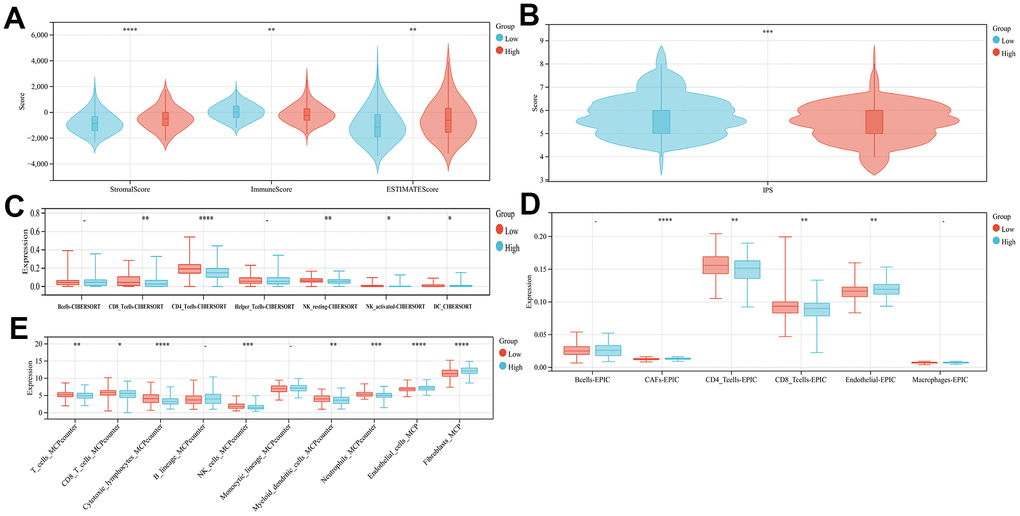
Figure 4.Comparison of the subgroup's immune activity. (A) The comparison of stromal, immune, as well as estimate scores among the low- and high-risk score groups (B) Comparison of the IPS score in high- and low-risk groups. Immuno-infiltration analysis using CIBERSORT (C), EPIC (D), and MCPcounter (E).