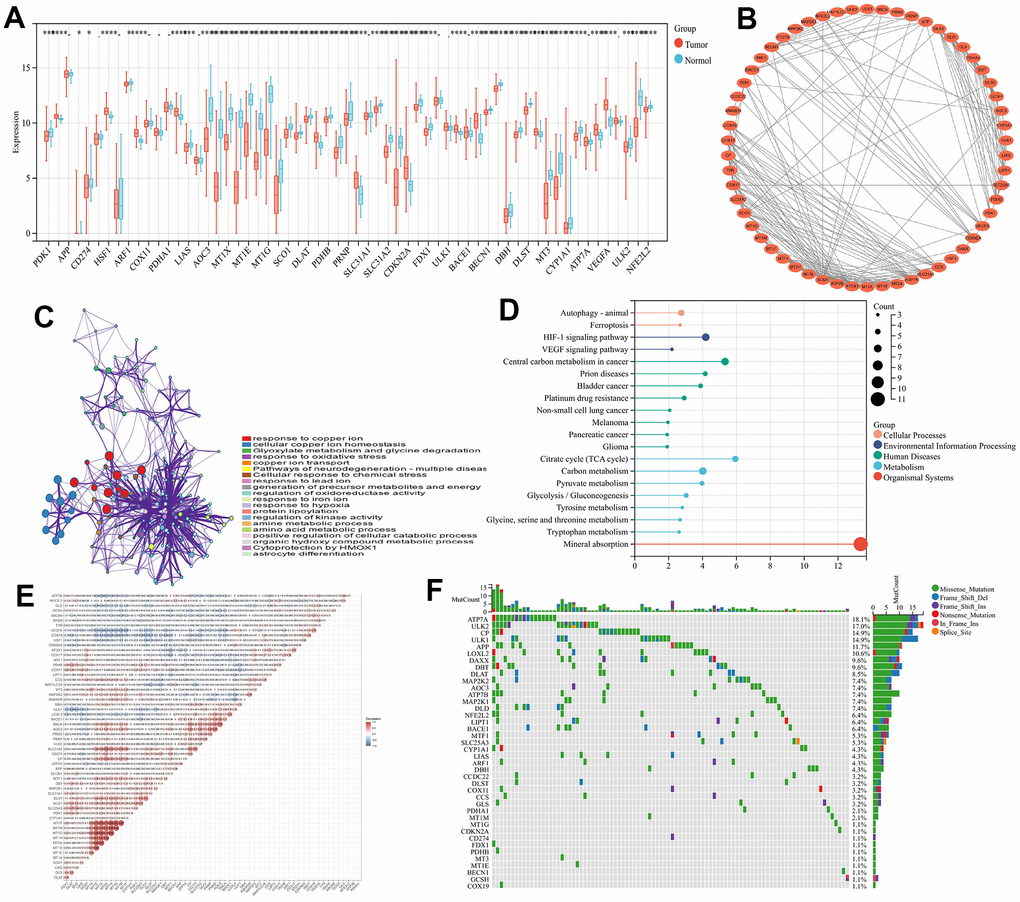
Figure 1.Study of the cuproptosis-related genes within CRC. (A) 61 CRGs transcriptional difference among normal and tumor tissues (B) Interactions among CRGs. The lines among the genes indicate their interactions. (C) GO analyses of CRGs (D) KEGG analyses of CRGs (E) Correlation analysis of CRGs (F) The waterfall plot of tumor somatic mutations of CRGs.