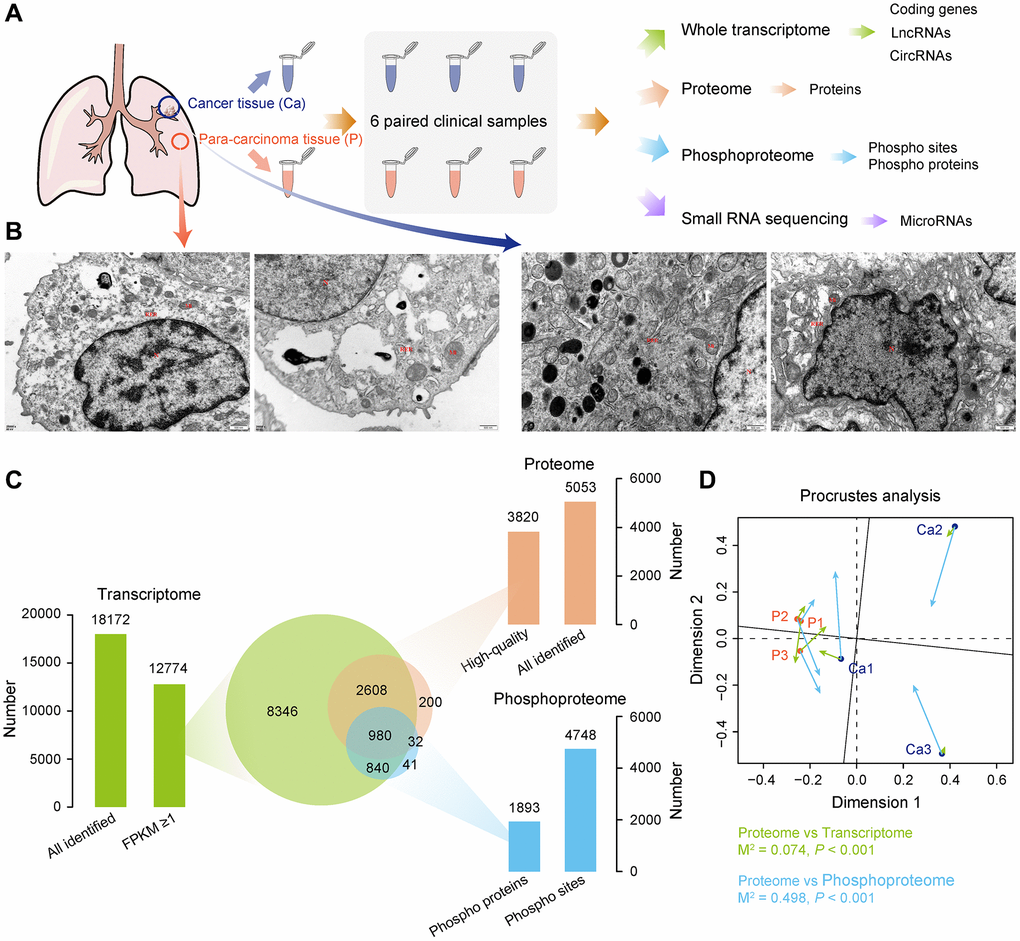
Figure 1.Multi-omics landscape of LUAD samples. (A) Experimental workflow to analyze transcriptome, proteome, phosphoproteome, and small RNA sequencing data. (B) Electron micrograph of the tissue section. Left, non-tumor tissue; right, LUAD tissue. (C) Quantitative statistics of total genes among transcriptome, proteome, and phosphoproteome, as well as the overlap of gene number among three omics. (D) Procrustes analysis shows the correlation between different omics.