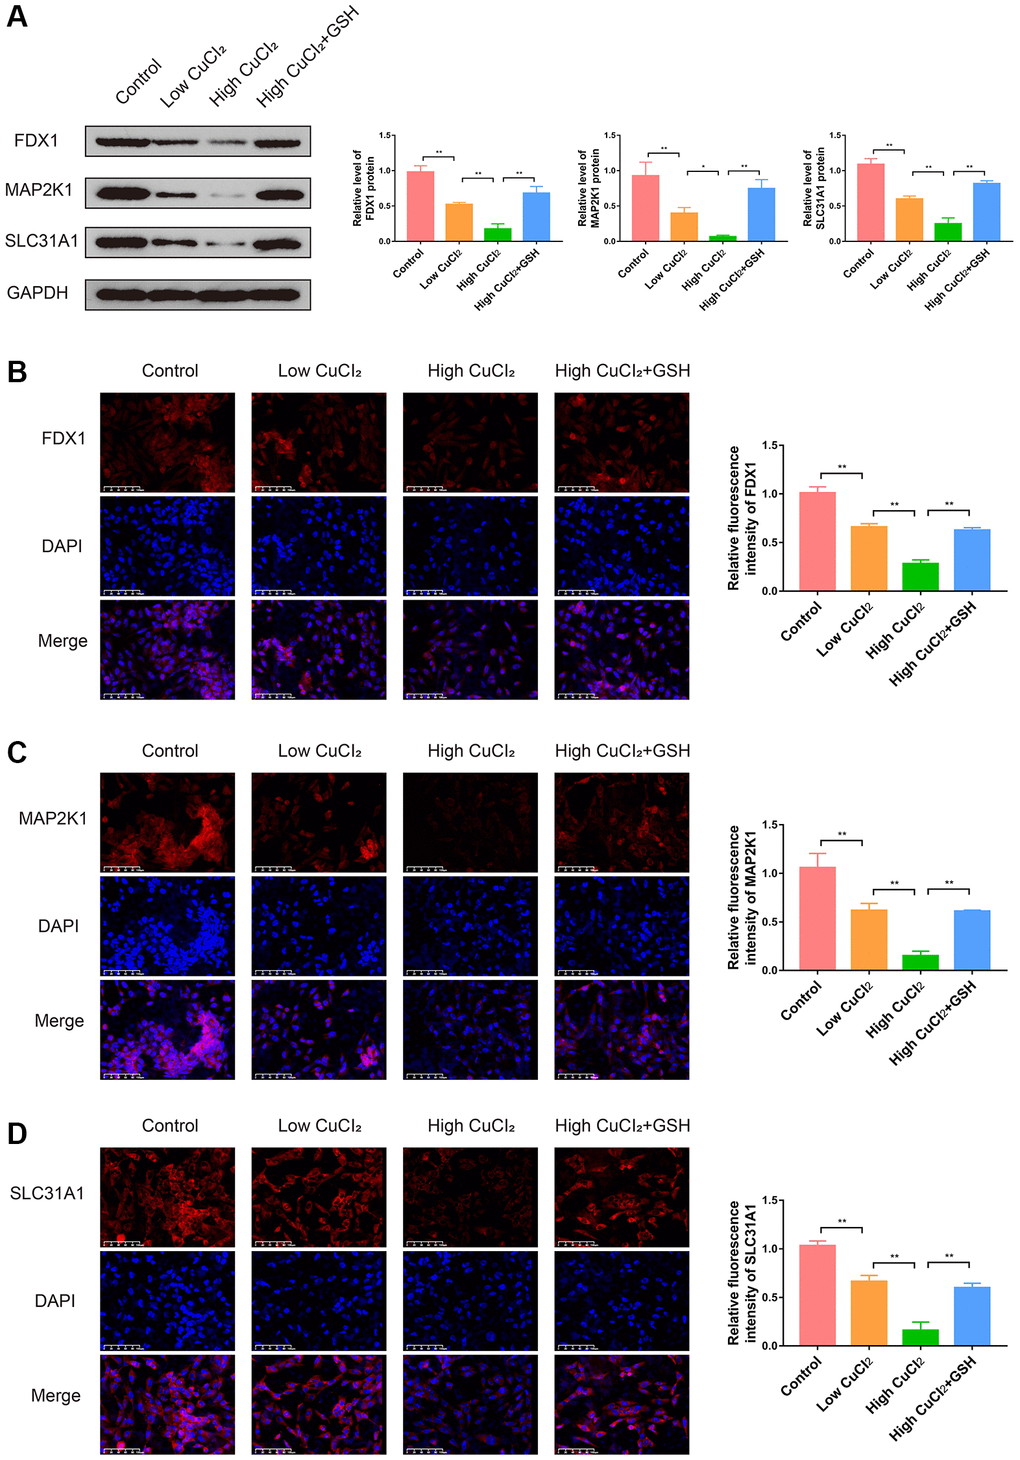
Figure 14.Effects of CuCl2 on the expression levels of three K-CRGs in AC16 cells. (A) The protein expression levels of three K-CRGs in AC16 cells (n = 3). (B–D) Typical immunofluorescence images and quantitative analysis of three K-CRGs in AC16 cells (n = 3). (*P < 0.05, **P < 0.01).