Submit an Article
Navigate
Home
Editorial Board
Editorial Policies
Current Volume
Archive
Scientific Integrity
Publication Ethics Statements
Interviews with Outstanding Authors
Newsroom
Sponsored Conferences
Podcast
Contact
Special Collections
Submit an Article
Online ISSN: 1945-4589
Research Paper
|
Volume 15, Issue 23
|
pp. 14141–14171
Comprehensive analysis reveals key genes and environmental toxin exposures underlying treatment response in ulcerative colitis based on
in-silico
analysis and Mendelian randomization
Back to article
Figure 9
(9 of 9)
−
100%
+
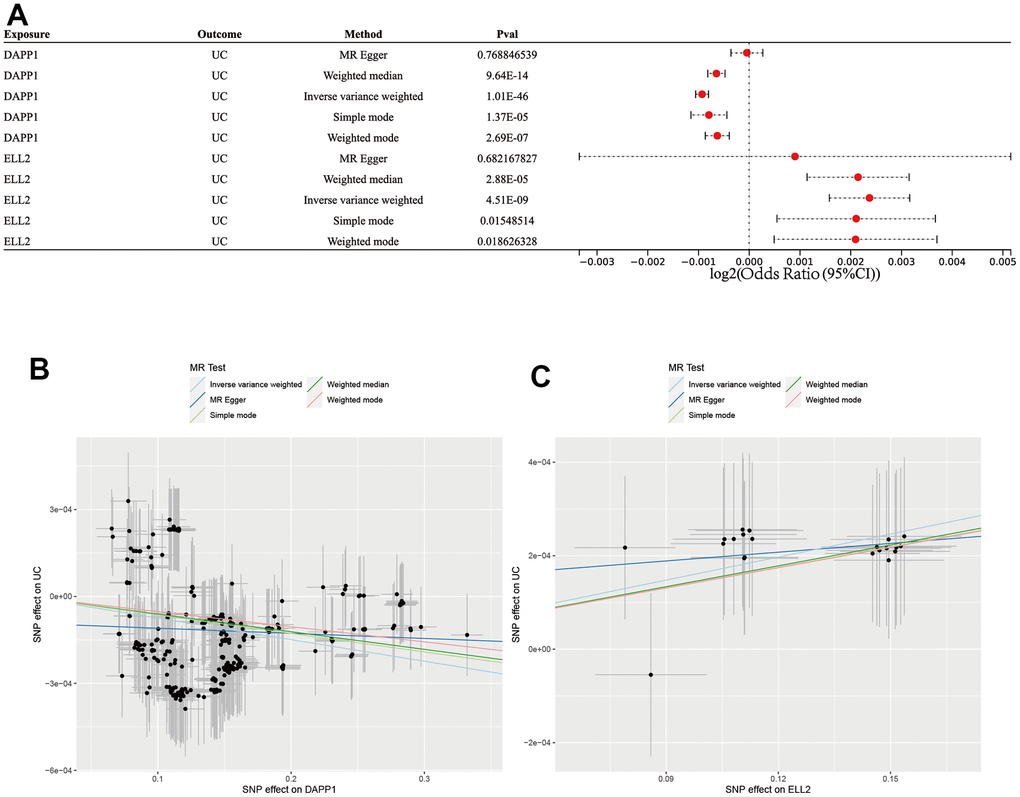
Figure 9.
(
A
) Forest plot showing results from the Mendelian randomization analysis. (
B
) The scatter plot of five MR methods between DAPP2 and UC. (
C
) The scatter plot of five MR methods between ELL2 and UC.