Submit an Article
Navigate
Home
Editorial Board
Editorial Policies
Current Volume
Archive
Scientific Integrity
Publication Ethics Statements
Interviews with Outstanding Authors
Newsroom
Sponsored Conferences
Podcast
Contact
Special Collections
Submit an Article
Online ISSN: 1945-4589
Research Paper
|
Volume 15, Issue 24
|
pp. 14764–14790
Conjoint research of WGCNA, single-cell transcriptome and structural biology reveals the potential targets of IDD development and treatment and JAK3 involvement
Back to article
Figure 2
(2 of 10)
−
100%
+
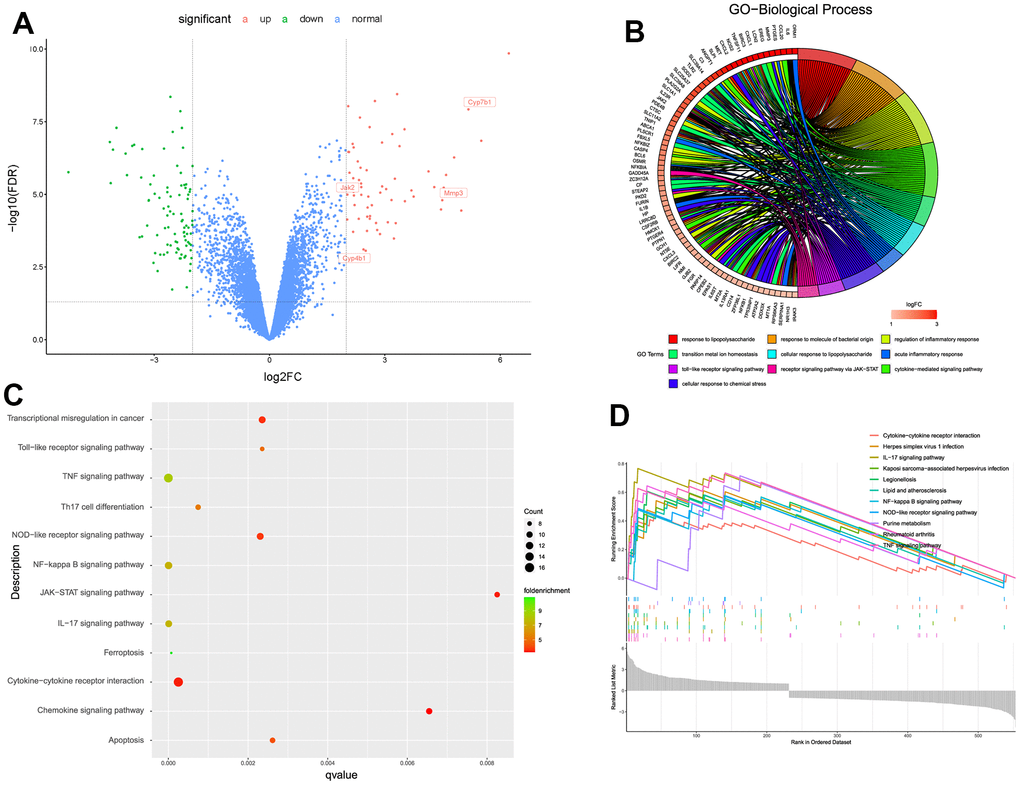
Figure 2.
(
A
) Volcano scatter plot of the genes analyzed by limma algorithm. (
B
) Biological functions about the up-regulated DEGs. (
C
,
D
) Aberrantly activated signaling pathways analyzed by KEGG, GSEA, respectively.