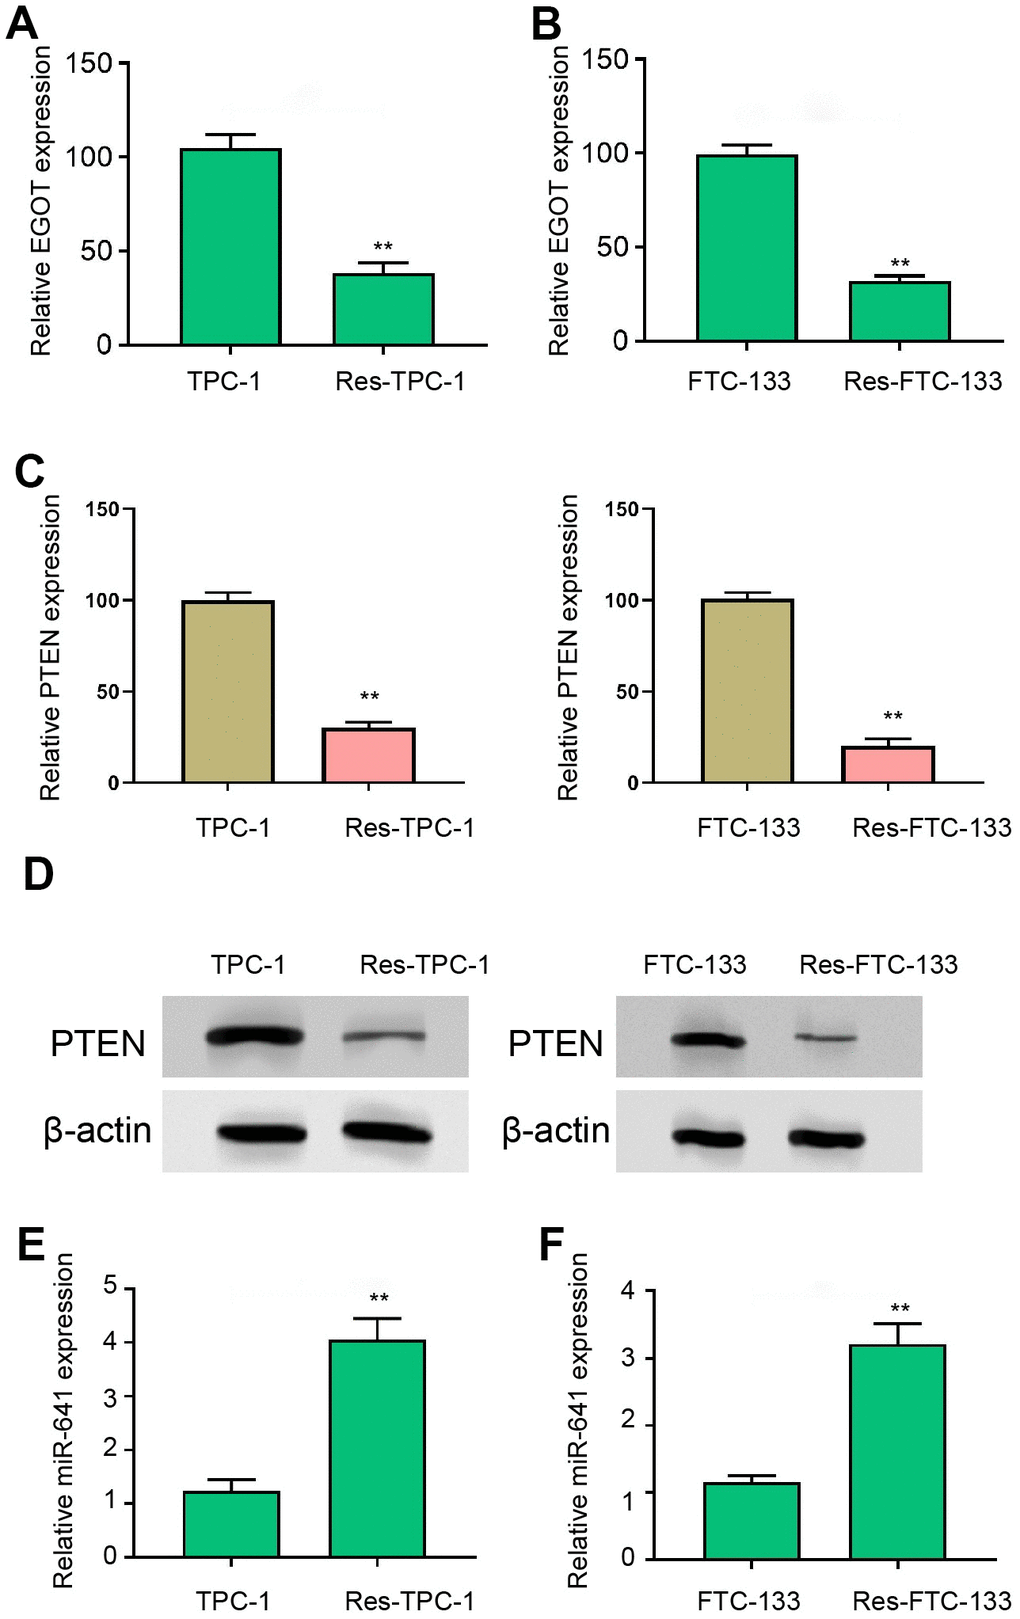
Figure 2.EGOT and PTEN expression is decreased and miR-641 expression is increased in 131I-resistant TC cells. (A, B) The qPCR analysis of EGOT in 131I -resistant TPC-1 and FTC-133 cells. (C) The qPCR analysis of PTEN in 131I -resistant TPC-1 and FTC-133 cells. (D) The Western blot analysis of PTEN in 131I -resistant TPC-1 and FTC-133 cells. (E, F) The qPCR analysis of miR-641 in 131I -resistant TPC-1 and FTC-133 cells. mean ± SD, ** P < 0.01. Experiments were repeated at least biological triplicates.