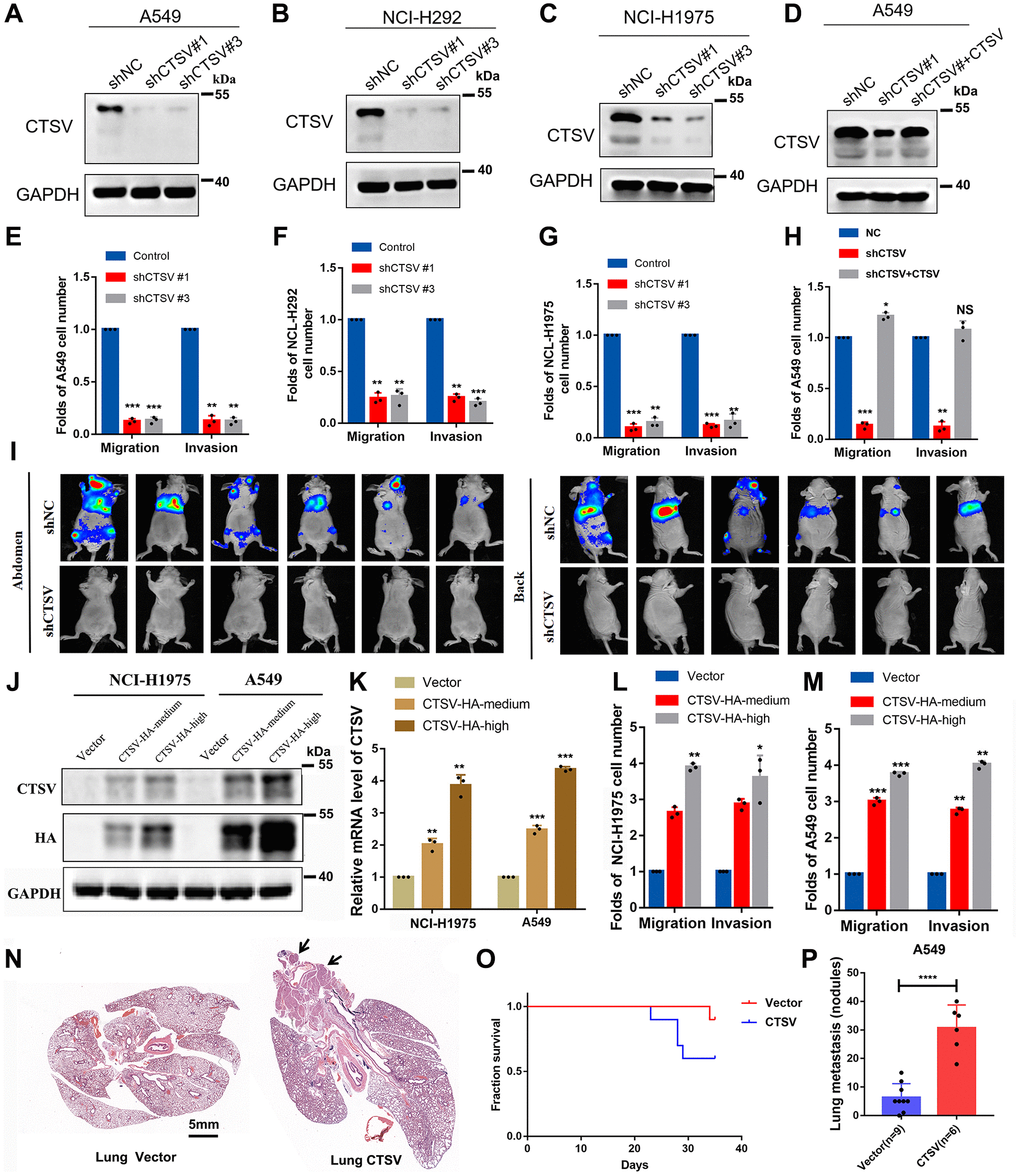
Figure 2.CTSV contributes to the metastasis of lung cancer cells both in vitro and in vivo. (A–C) A549, NCI-H292, and NCI-H1975, lung cancer cells transfected with the indicated negative control plasmids, shCTSV#1 or shCTSV#3, for 48 h were analyzed by Western blotting. The results were repeated for three biologically independent experiments. (D) The indicated stable cells transfected with shCTSV#1 and HA-CTSV for 48 h were subjected to Western blotting. The grouping of blots cropped from different parts of the same gel. (E–H) The indicated stable cells were analyzed by cell migration and invasion assays. The results are the mean ± SD of three biologically independent experiments. *P < 0.05, **P < 0.01, ***P < 0.001 were analyzed by using the student’s t-test. NS represents no significance. (I) Bioluminescent imaging analysis of mice. Representative images are shown (n = 6 mice per group). The tumors were isolated at the end of the experiments. (J–M) CTSV-HA-medium or CTSV-HA-high NCI-H1975 and A549 cells were transiently transfected with sgRNAs as indicated and then analyzed by Western blotting, qRT-PCR, cell migration, and invasion assays. The results showed that with the increase in CTSV expression (2–5 times the normal value), the promoting effect of CTSV on migration and invasion also improved. The grouping of blots cropped from different parts of the same gel. (N–P) H&E staining of lungs from representative tumor-bearing nude mice. Scale bars, 5 mm. Kaplan-Meier survival curves of the nude mice in the vector and CTSV-HA groups. Quantification of lung nodules. Data are shown as the mean ± SD and P-values; two-tailed Student’s t-tests were used to analyze the data. ****P-value < 0.0001. Full-length blots are shown in Supplementary Figure 1.