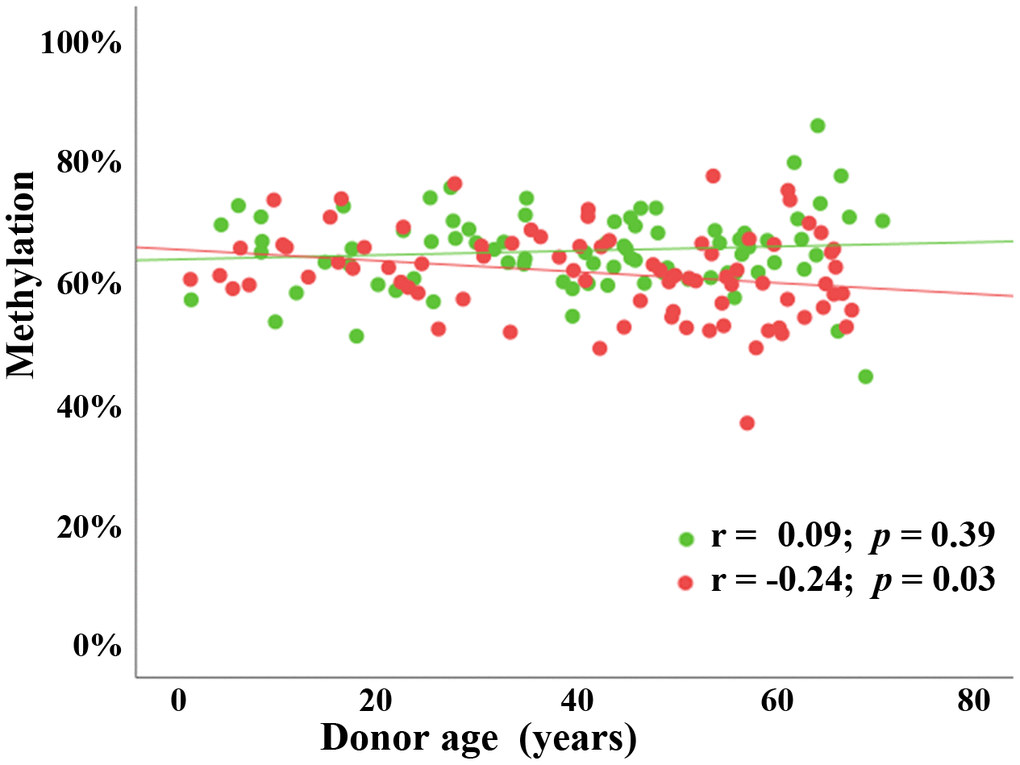
Figure 3.Sex-specific (chronological) age effect on BEGAIN promoter methylation in peripheral blood samples. Scatter plot showing significant negative correlation (Pearson’s r = -0.24; p = 0.03) between chronological donor age (x-axis in years) and mean methylation (y-axis in %) in 82 male blood samples (red dots) using BPS. There was no detectable age effect (Pearson’s r = 0.09; p = 0.39) in 80 female blood samples (green dots).