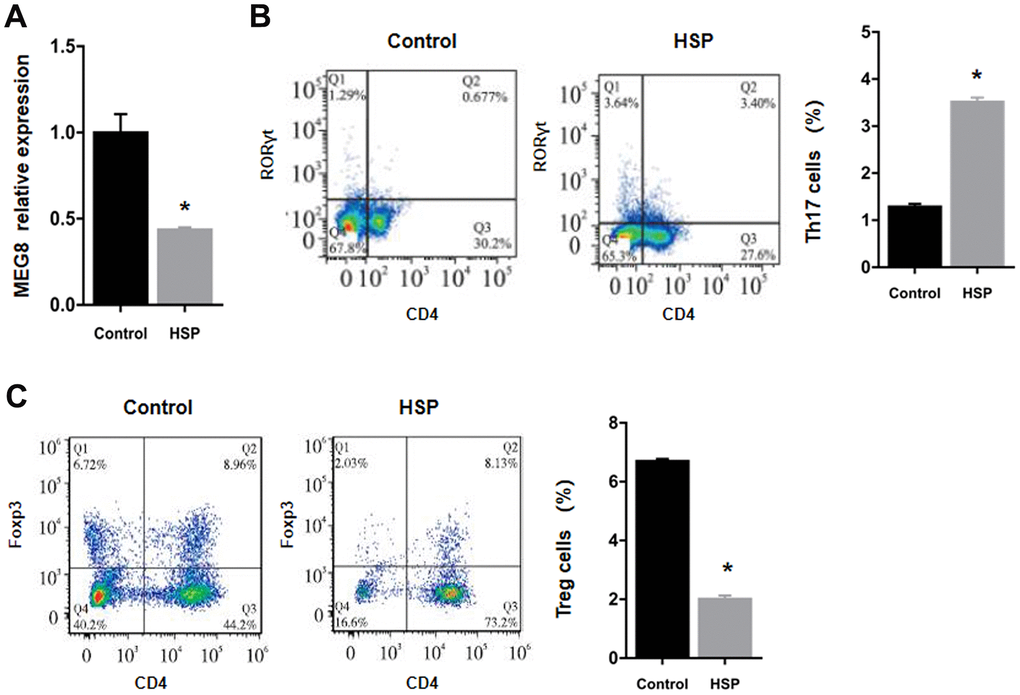
Figure 1.Downregulation of the expression of MEG8 and Treg cell presence within HSP rats. (A) Determination of the expression of MEG8 in peripheral blood by qRT-PCR. (B, C) The percentages of Th17 and Treg cells were determined in PBMCs derived from control rats (n = 20) and HSP rats (n = 20). *P < 0.01 vs. Control group.