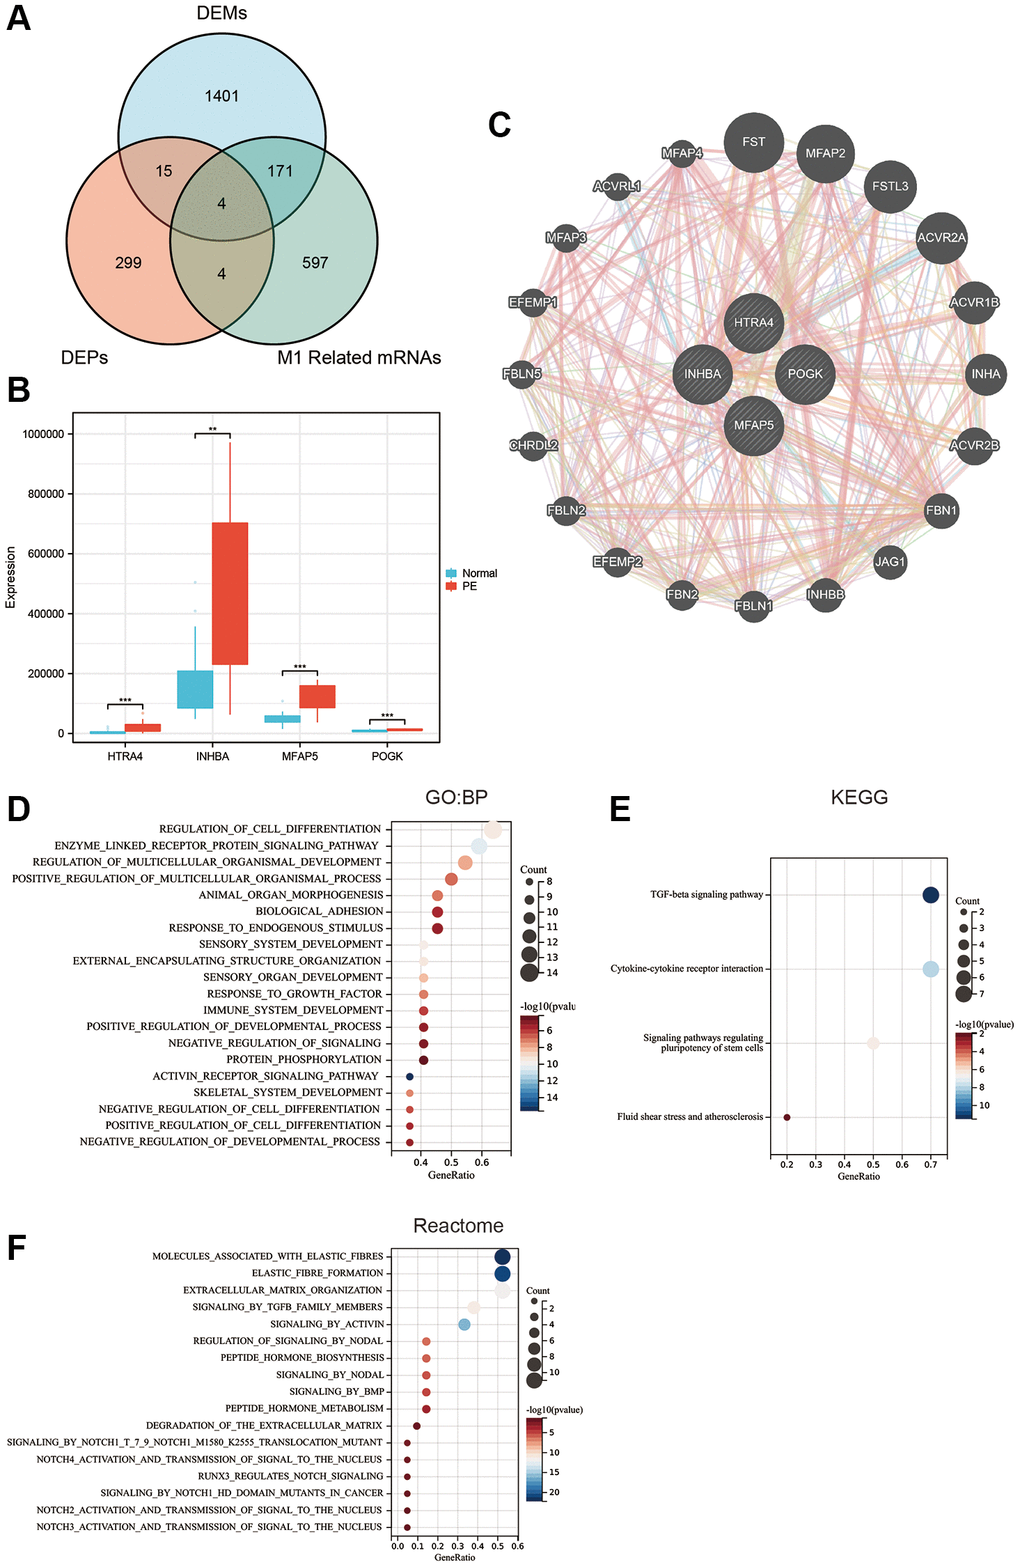
Figure 5.Hub protein screening and enrichment analysis. (A) Venn diagram of the intersection of differentially expressed proteins, differentially expressed mRNA, and M1 macrophage-related mRNA. (B) Box plot of differentially expressed hub proteins. (C) Protein-protein interaction network. (D) GO enrichment analysis. (E) KEGG enrichment analysis. (F) Reactome enrichment analysis.