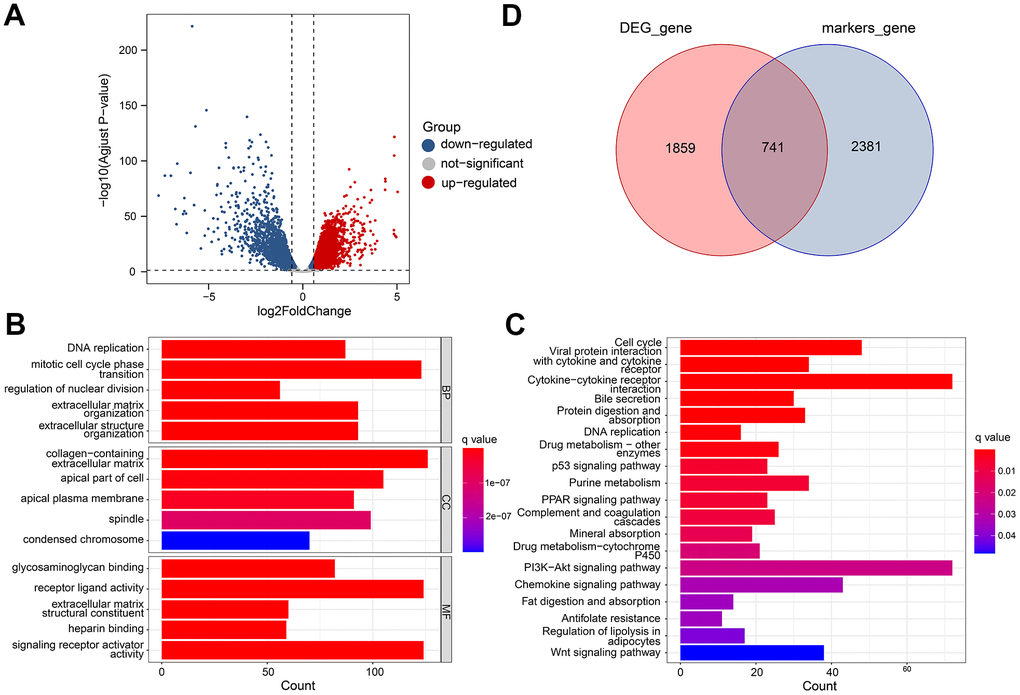
Figure 5.Differential gene analysis of in TCGA datasets. (A) A volcano plot showing the DEGs in the TCGA cohort that are up-regulated and down-regulated. (B, C) GO and KEGG enrichment analysis of the identified DEGs. (D) Venn diagram analysis of DEGs and marker genes.