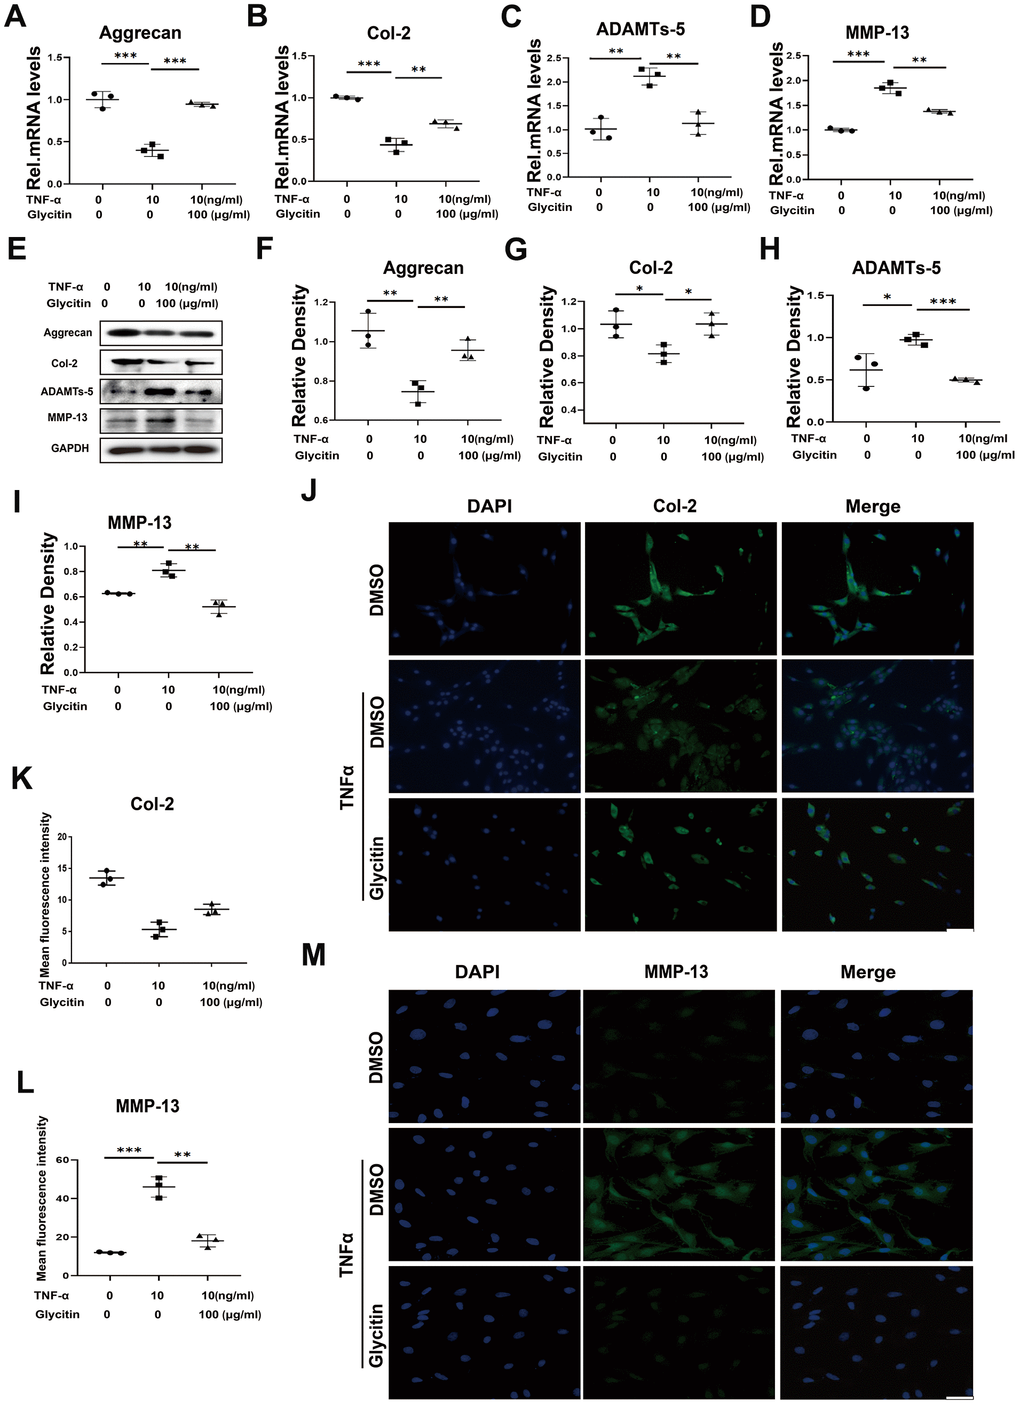
Figure 2.Glycitin restrained ECM metabolism and alleviated. (A–D) Transcriptional and (E) protein levels of Aggrecan, Col-2, ADAMTs-5 and MMP-13 in cells as determined by RT-PCR and WB method. (F–I) Quantitative analysis of immunoblotting in (E), assayed by ImageJ program. (J–M) IF staining of COX-2, fluorescence intensity analysis was performed using ImageJ program. Scale bar: 100 μm. The values represent the mean ± SD of three independent experiments. *p < 0.05 vs. control group.