Submit an Article
Navigate
Home
Editorial Board
Editorial Policies
Current Volume
Archive
Scientific Integrity
Publication Ethics Statements
Interviews with Outstanding Authors
Newsroom
Sponsored Conferences
Podcast
Contact
Special Collections
Submit an Article
Online ISSN: 1945-4589
Research Paper
|
Volume 15, Issue 22
|
pp. 13422–13433
Effect of Nrf2 on brain injury induced by hydraulic shock via regulation of mitophagy and apoptosis
Back to article
Figure 2
(2 of 5)
−
100%
+
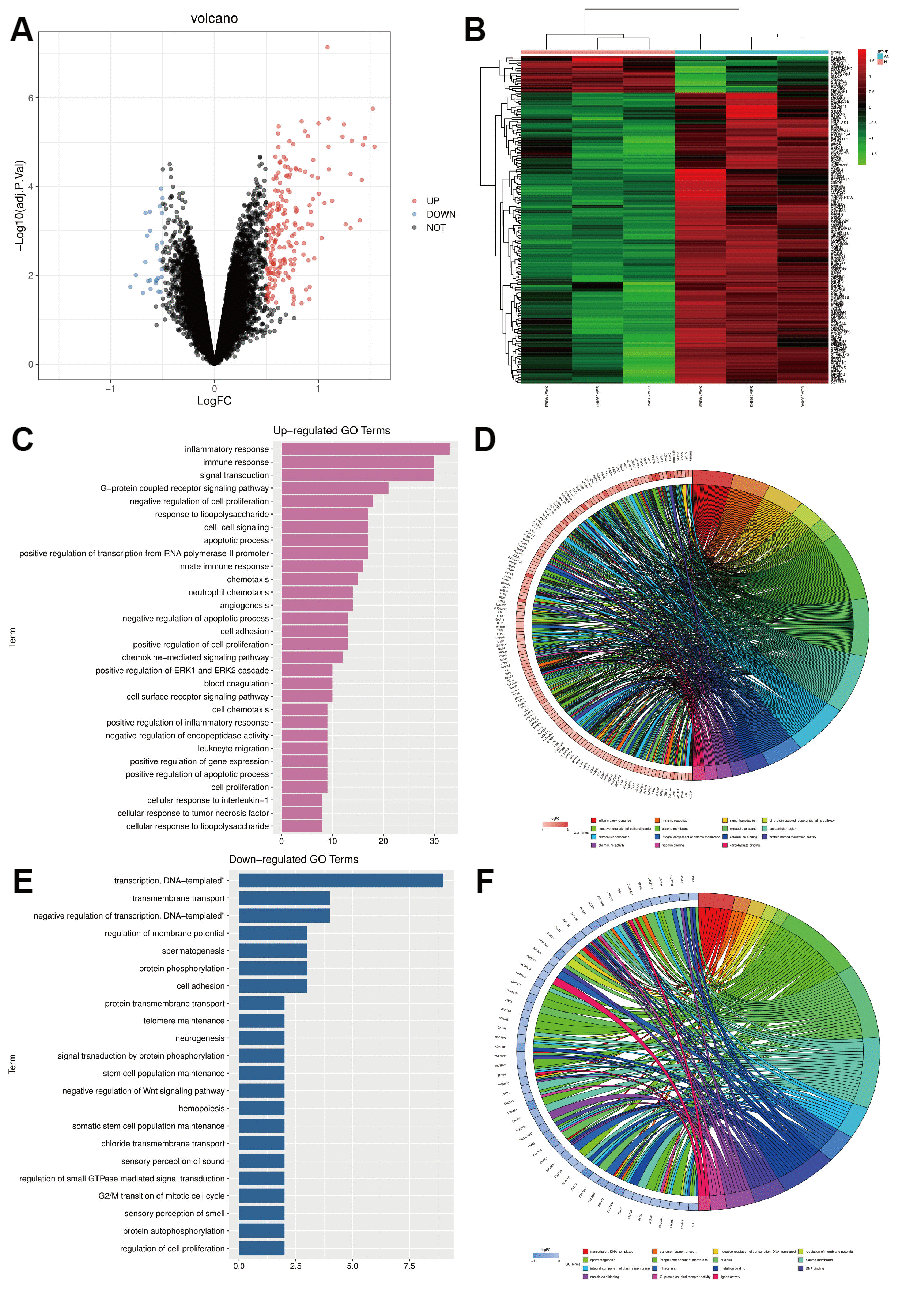
Figure 2.
(
A
) GSE24265 differential gene volcano map; (
B
) GSE24265 differential gene cluster analysis heat map; (
C
,
D
) GO enrichment analysis of the up-regulated pathway; (
E
,
F
) GO enrichment analysis of down-regulated pathway.