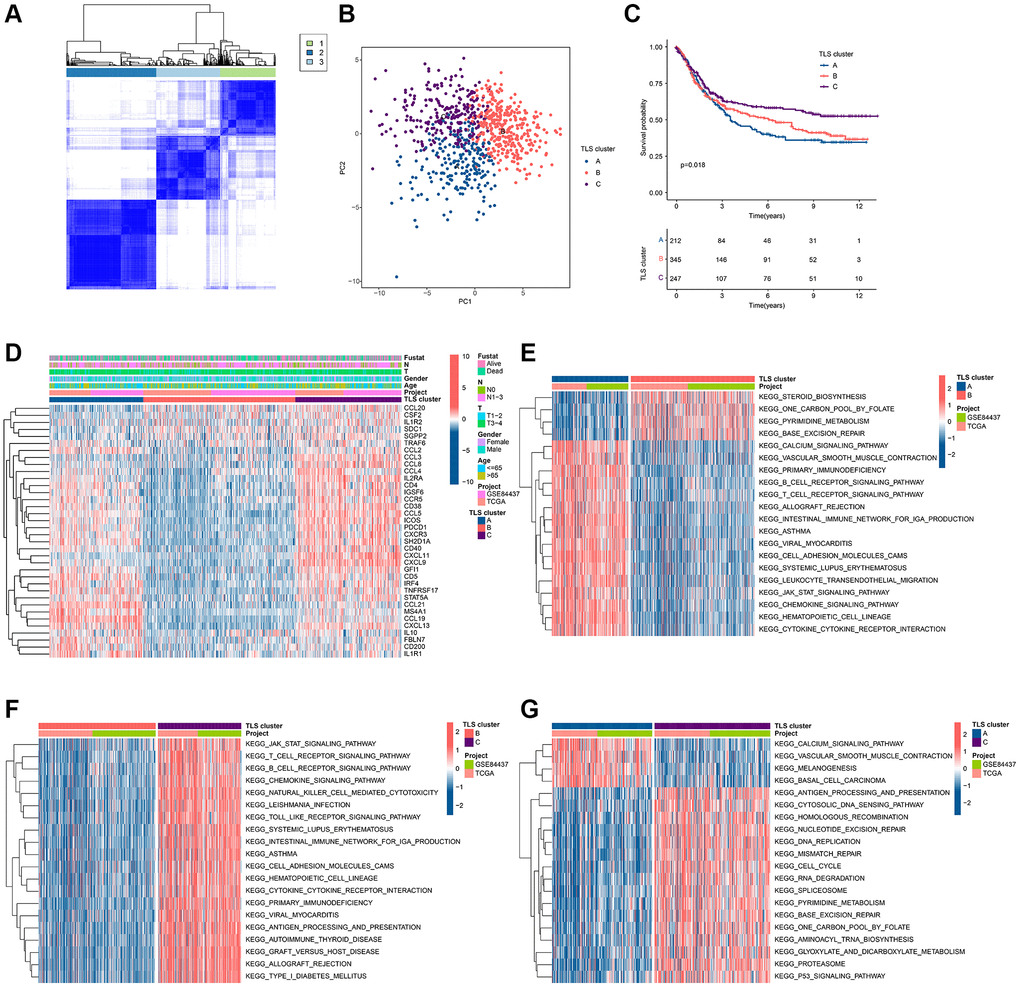
Figure 2.Identification of TLS subgroups in GC. (A) Results of unsupervised clustering analysis. (B) PCA results of three clusters. (C) KM curves of three clusters. (D) Heat map of TLS-RGs expression in three clusters. (E) Enrichment analysis of differential genes between cluster A and cluster B. (F) Enrichment analysis of differential genes between cluster A and cluster B. (G) Enrichment analysis of differential genes between cluster A and cluster B.