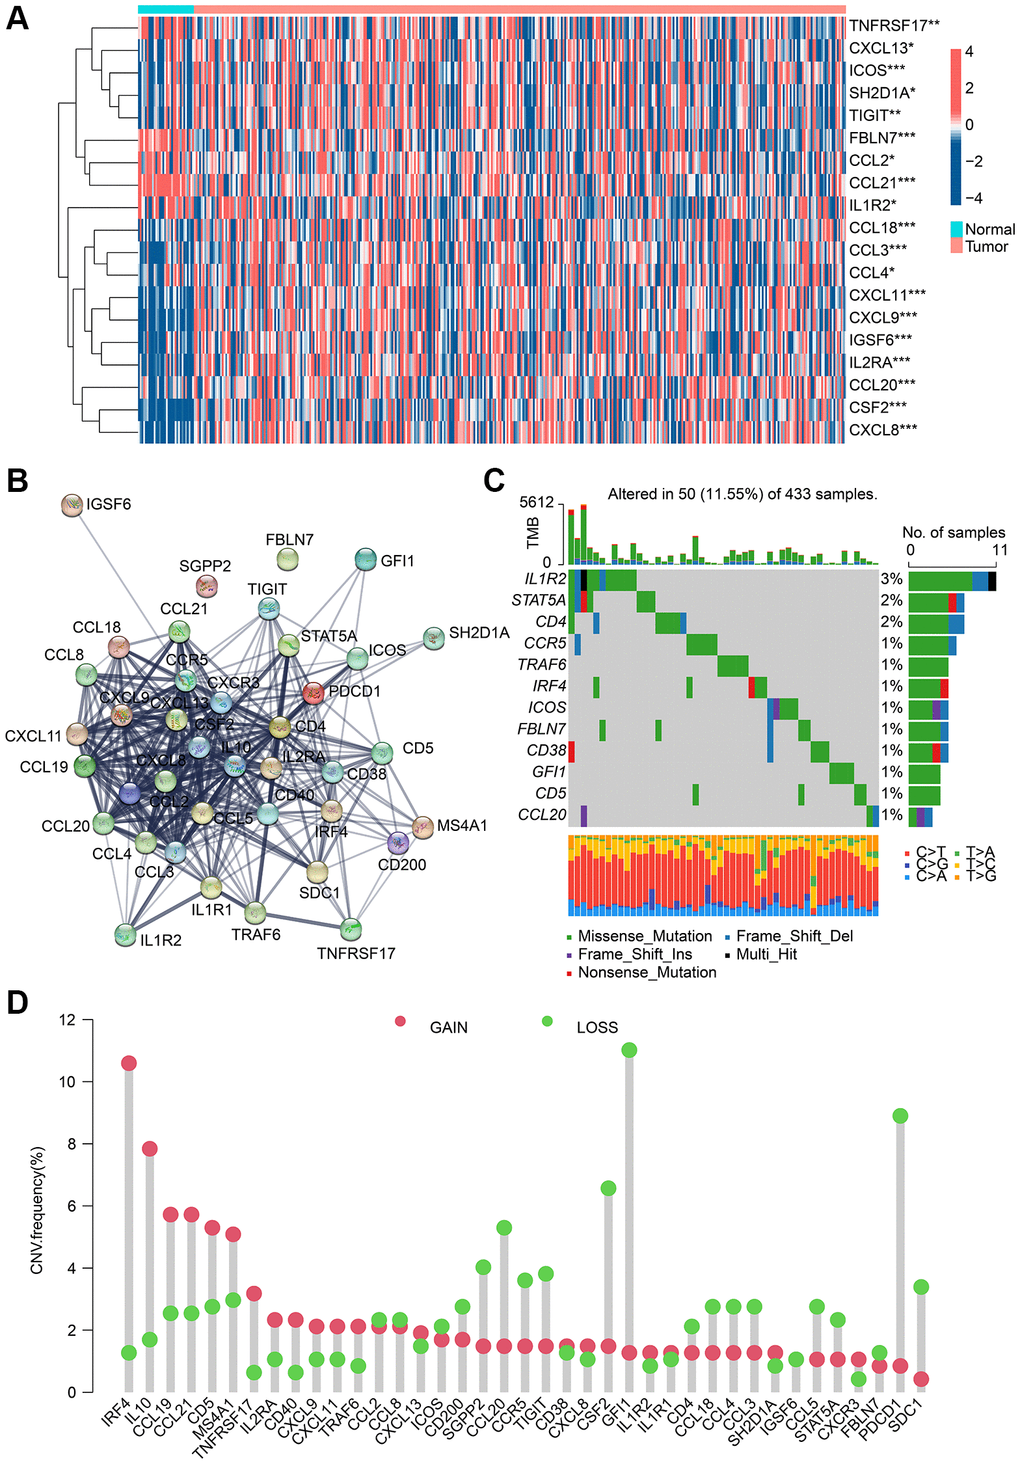
Figure 1.Analysis result of TLS-RGs in expression and mutational landscape. (A) Result of DE-TLS-RGs expression in normal and GC tissues. (B) PPI network analysis of TLS-RGs. (C) Somatic mutational landscape of TLS-RGs. (D) CNV frequencies of TLS-RGs in GC. *p < 0.05; **p < 0.01; ***p < 0.001.