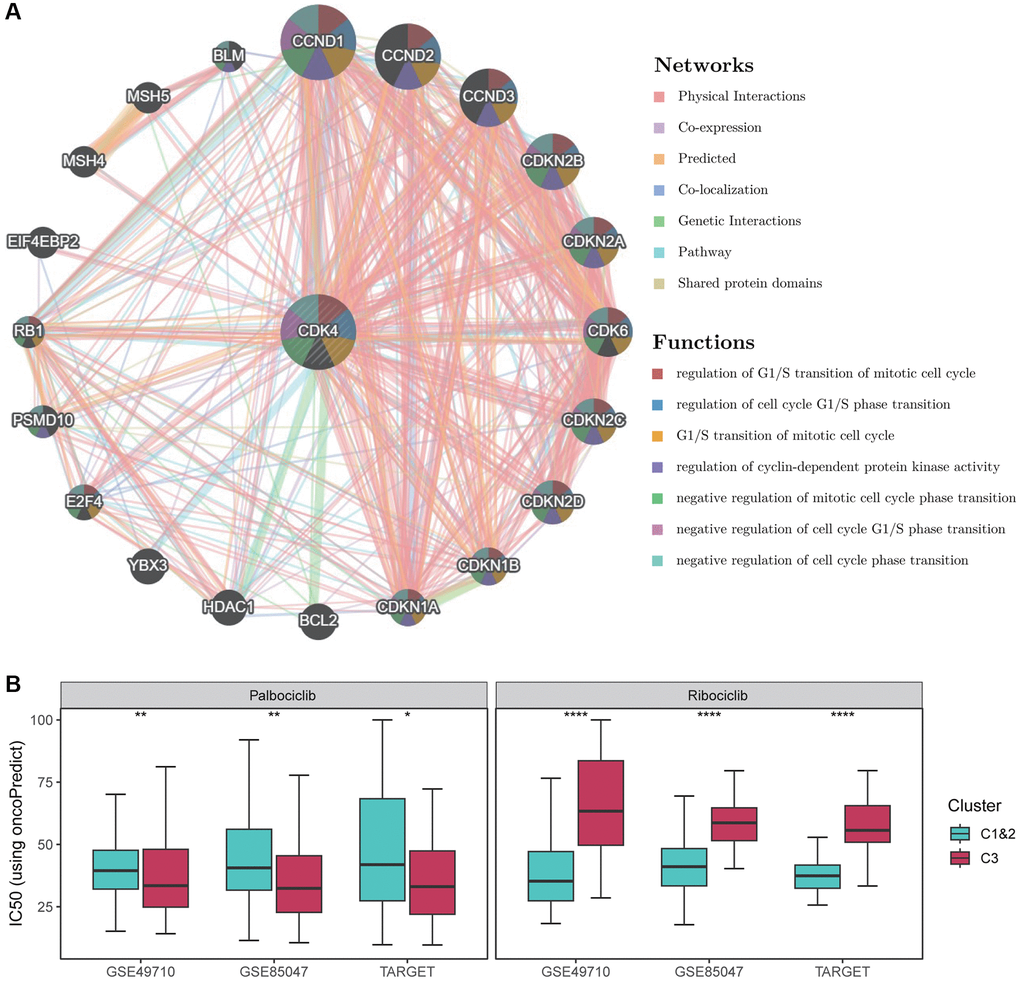
Figure 5.Drug sensitivity analysis of CDK4 inhibitors. (A) Functional analysis of the protein-protein interaction network and CDK4, along with its neighboring genes. The edges of the network are color-coded to indicate the bioinformatics methods used, including physical interactions, co-expression, site prediction, co-localization, pathway and genetic interactions, and shared protein structural domains. The nodes of the network are also color-coded to reflect the enrichment results of the genome. The size of each circle corresponds to the rank of the gene associated with CDK4, while the width of each line represents the weight of the data source used in the composite network. (B) Box plots show the distribution of IC50 values for Palbociclib as well as Ribociclib in Fges-derived subtypes. P-values were obtained from t-tests. *p < 0.05; **p < 0.01; ****p < 0.0001.